
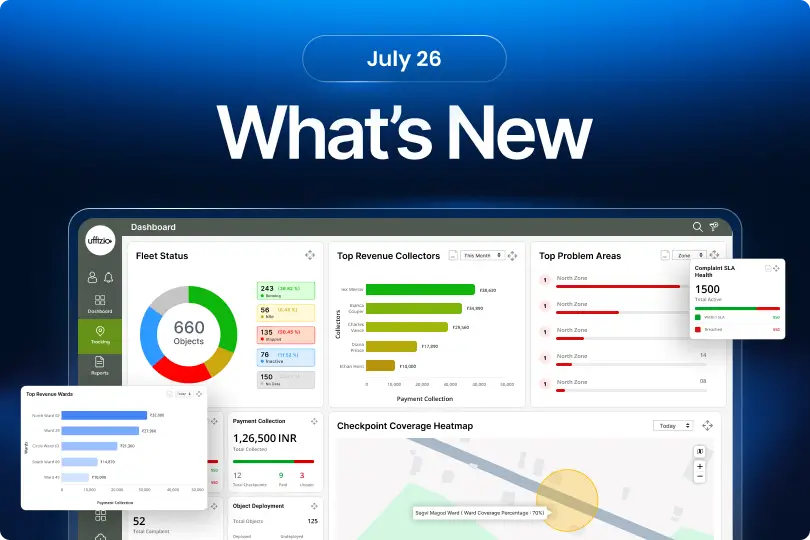
Every enhancement begins with a real-world challenge. At Uffizio, we continuously work with customers, partners, and industry experts to understand evolving operational needs and transform their feedback into meaningful product improvements.
This edition of What’s New brings together the latest enhancements across our solutions, introducing smarter automation, AI-powered capabilities, advanced analytics, richer visualizations, and improved user experiences. From fleet management and waste collection to indoor tracking, these updates are designed to simplify daily operations, improve decision-making, and help organizations deliver greater efficiency at every stage.
1. Trakzee updates
1.1 Share driver license details along with live location
When you share a vehicle’s live location, sometimes knowing where the vehicle is isn’t enough. The person receiving the link may also need to verify who is driving, especially for operations where driver identification and license information are important.
To make shared location details more useful, Trakzee now extends driver details with driving license information.
 What’s updated
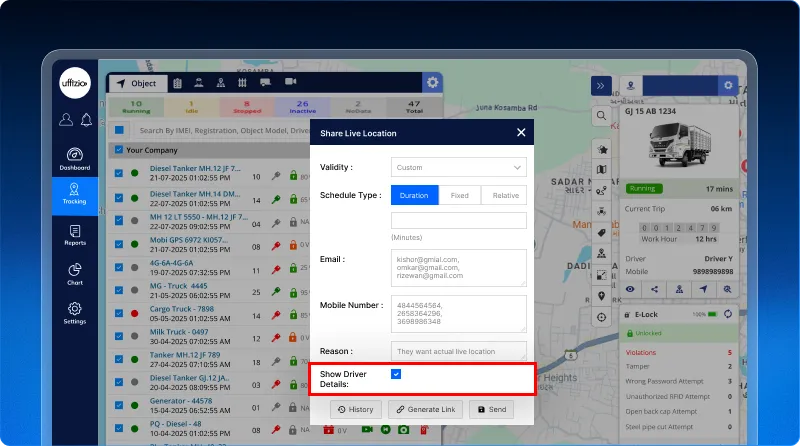
Along with the existing driver name and mobile number, users can now choose to include the driver’s driving license number and license expiry date when sharing a vehicle’s location.
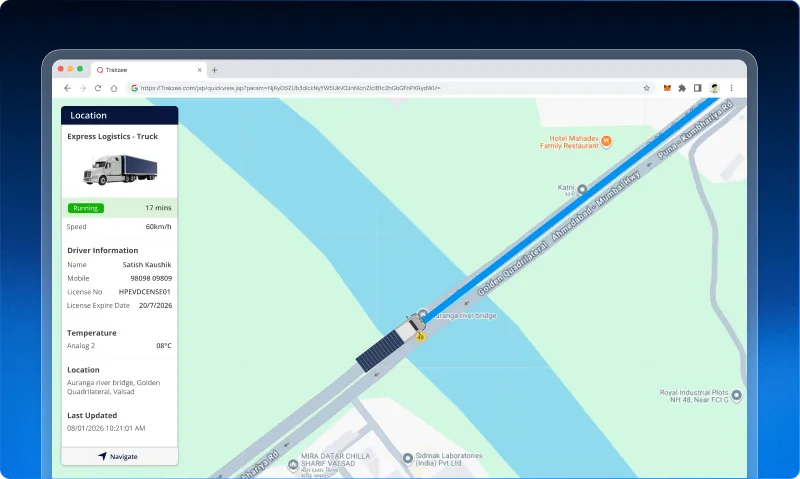
When driver details are enabled, the available license information will appear in the shared location across web and mobile. The same information is also included in the share location API, helping maintain consistency across platforms and integrations.
Only available driver information is displayed, keeping the shared view relevant and clean.
 Key benefits
- Provides more complete driver identification with shared locations.
- Helps recipients verify driver and license information quickly.
- Supports operations where driver documentation and compliance visibility are important.
- Keeps driver information consistent across web, mobile, and API.
- Gives users control over whether driver details are included in the shared location.
Business impact
By adding driving license details to share location, Trakzee makes location sharing more useful for businesses that need both vehicle visibility and driver verification. It provides additional context without changing the existing sharing workflow, helping teams share more complete information when required.
1.2 Driver detection alerts now support Face ID and Driver ID
Every fleet operates differently. While some rely on facial recognition for driver verification, others depend on driver IDs due to hardware, operational, or environmental limitations. Restricting alerts to a single verification method can make driver monitoring less effective in these scenarios.
To provide greater flexibility, Trakzee now allows driver detection alerts to be triggered using either face ID or driver ID, depending on your operational requirements.
What’s updated
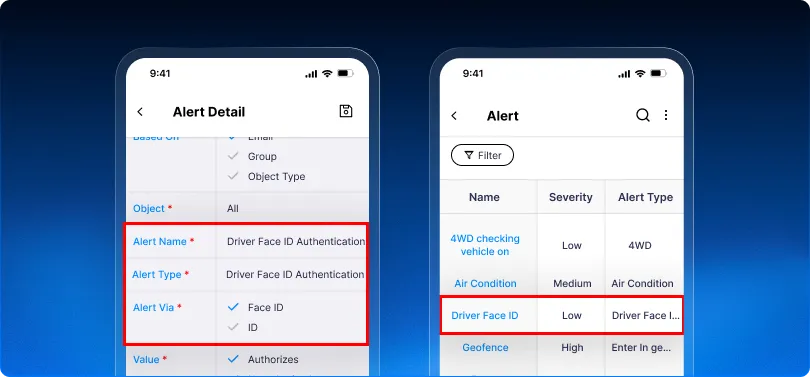
The existing driver face ID recognition alert has been enhanced with a new Alert Via configuration.
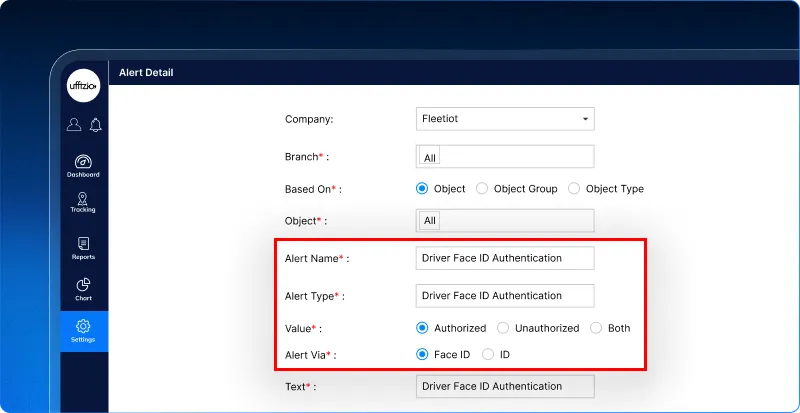 Users can now choose how the alert should validate the driver:
- Face ID – Uses the existing facial recognition logic (default).
- Driver ID – Triggers alerts based on driver ID validation.
The selected option is applied consistently across both the web and mobile applications, ensuring alerts follow the configured validation method without changing the existing alert workflow.
 Key benefits
- Choose the most suitable driver validation method for your operations.
- Continue using existing Face ID recognition or switch to Driver ID verification.
- Improve flexibility in environments where facial recognition may not be practical.
- Maintain a consistent alert experience across Web and Mobile.
- Configure driver detection alerts without affecting existing users or workflows.
Business impact
By supporting both Face ID and Driver ID validation, Trakzee gives organizations greater control over how driver detection alerts are generated. This flexibility helps businesses adapt to different deployment environments while maintaining reliable driver monitoring and improving operational compliance.
1.3 Monitor trip-wise average temperature with greater clarity
For temperature-sensitive operations, knowing the temperature at the start or end of a trip tells only part of the story. What happens throughout the journey matters just as much, especially when transporting food, pharmaceuticals, or other temperature-sensitive goods.
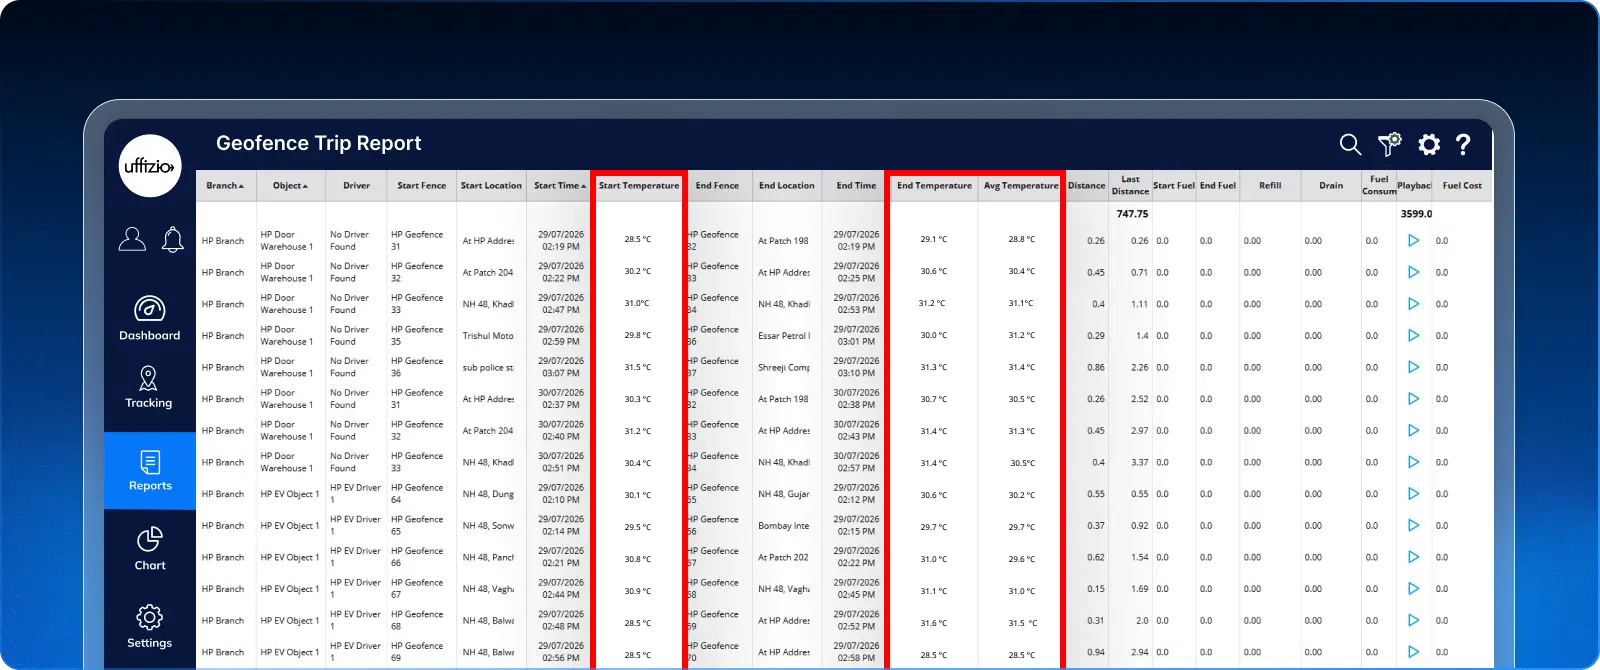
To provide a clearer picture of temperature conditions during each journey, the Geofence Trip Report now includes trip-wise average temperature.
What’s updated
A new average temperature column has been added to the geofence trip report between end temperature and distance.
Instead of relying only on individual temperature readings, the system calculates the average using all available temperature data recorded during the trip. The value is displayed in °C or °F based on the configured system setting.
The same information is also available in downloaded and scheduled reports, ensuring consistent temperature visibility across all report formats. If temperature data is unavailable for a trip, the report will indicate that no value is available.
Key benefits
- Understand the overall temperature conditions maintained during each trip.
- Get more meaningful insights than individual or latest temperature readings.
- Identify temperature variations more effectively during trip analysis.
- Maintain consistent temperature information across on-screen, downloaded, and scheduled reports.
- Support better monitoring of temperature-sensitive fleet operations.
Business impact
Trip-wise average temperature provides businesses with a more meaningful view of conditions maintained throughout a journey. This can help teams monitor temperature-sensitive operations more effectively, investigate potential issues, and maintain better records for operational and compliance requirements.
1.4 Track PTO activity with colour-coded playback routes
Knowing where a vehicle travelled is useful, but for vehicles operating auxiliary equipment, it is equally important to know what was happening along the way. For example, fleet operators may need to understand exactly where a sweeper, hydraulic pump, crane, or other PTO-powered equipment was being used during a trip.
To provide this visibility, Trakzee Premium now brings PTO active sensor data into playback, allowing users to visually connect PTO activity with the vehicle’s historical route.
PTO (Power Take-Off) is a system that uses the vehicle’s engine power to operate auxiliary equipment such as hydraulic pumps, sweepers, or cranes.
What’s updated
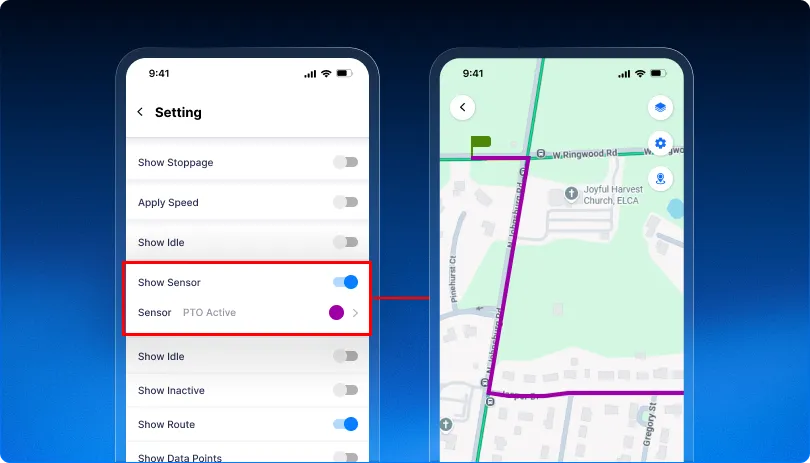
A new PTO active option is now available in the sensor dropdown within playback settings on Web and Mobile.
When PTO active is selected, the historical route is colour-coded based on whether the PTO was active or inactive at different points of the journey. A map legend helps users understand the sensor states while reviewing the route.
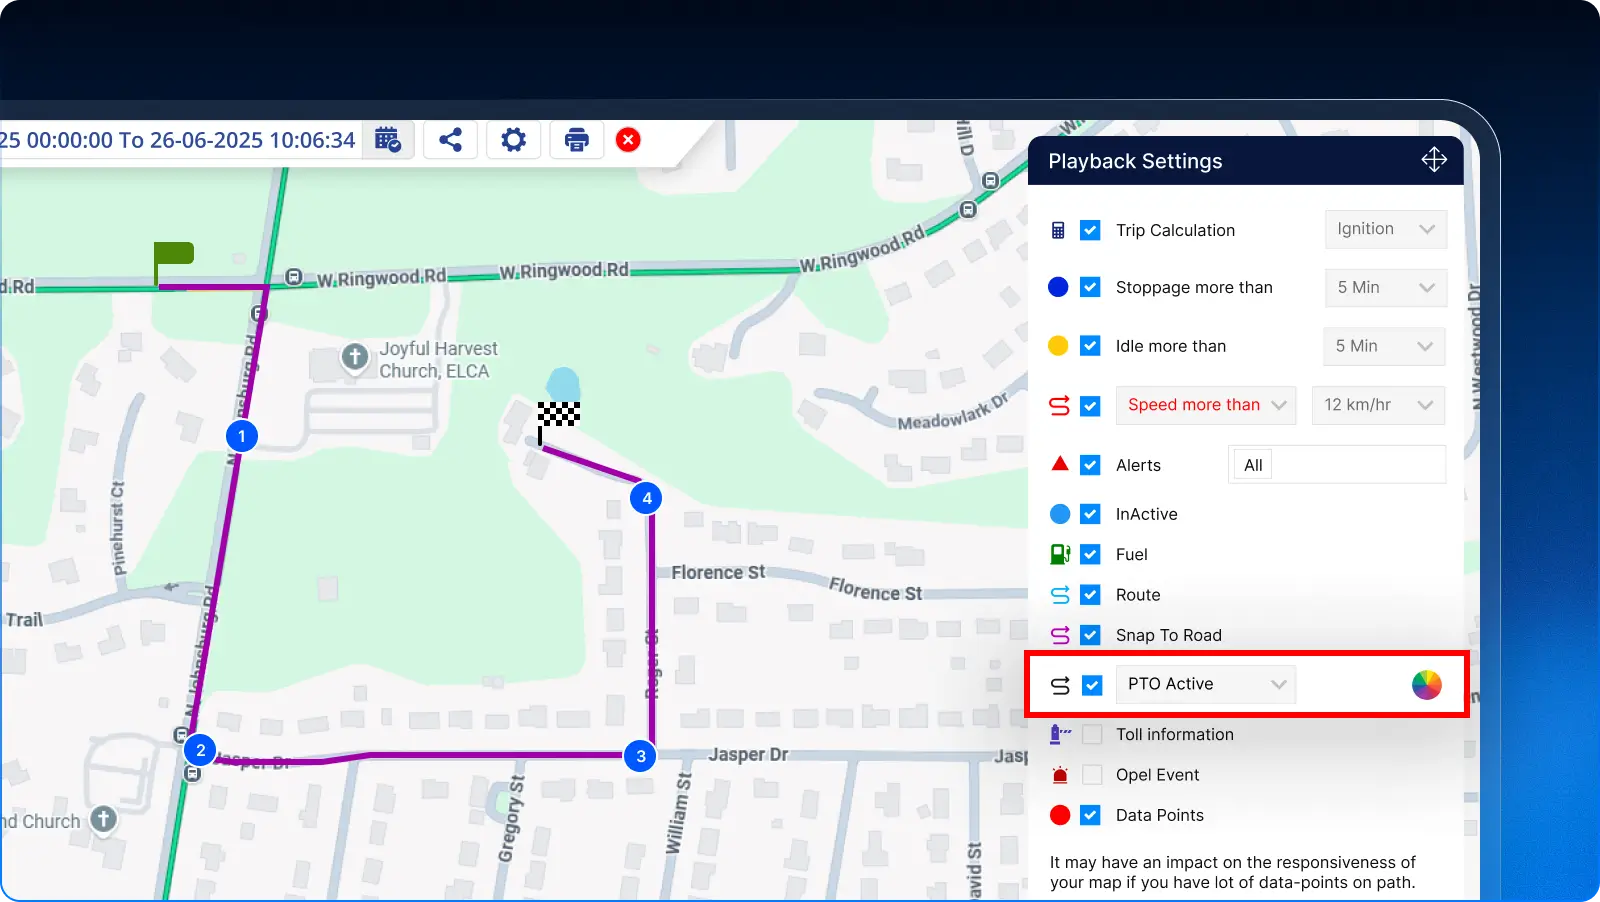
The sensor dropdown also dynamically displays sensors configured for the selected vehicle. This means users see only the sensor options relevant to that vehicle, creating a cleaner and more useful playback experience.
This enhancement is available with Trakzee premium.
 Key benefits
- See where PTO-powered equipment was active during a historical trip.
- Understand equipment usage alongside vehicle movement.
- Quickly differentiate active and inactive PTO periods through colour-coded routes.
- View only the sensors configured for the selected vehicle.
- Improve investigation of field operations without reviewing sensor data separately.
- Get the same sensor-based playback experience across web and mobile.
Business impact
By combining PTO activity with historical route visualization, businesses can better understand how and where auxiliary equipment was actually used. This provides valuable operational context for fleets such as road sweepers, cranes, utility vehicles, and other specialized vehicles, making Playback a more powerful tool for reviewing field activity and equipment utilization.
1.5 Secure EVs remotely with ignition lock control
Managing EV security sometimes requires more than just knowing where the vehicle is. Fleet operators may also need a way to prevent unauthorized vehicle use or remotely control whether a vehicle can be started.
Trakzee now introduces digital output ignition lock for EVs, allowing users to remotely lock or unlock the vehicle ignition from the platform using a configured digital output sensor. The functionality is available across both web and mobile applications.
Ignition Lock uses a digital output connection to remotely enable or disable a vehicle’s ignition.
What’s updated
A new digital output (ignition lock) option can now be configured for EVs through the object Sensor settings. Once configured, users can control the ignition directly from the security widget in live tracking.
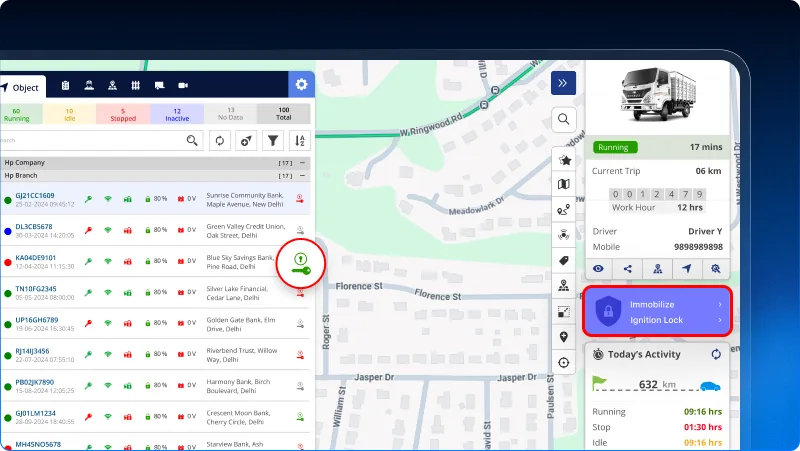 Users can:
- Lock or unlock the vehicle ignition remotely.
- View the current ignition lock status in the object list.
- Confirm the action before a lock or unlock command is sent.
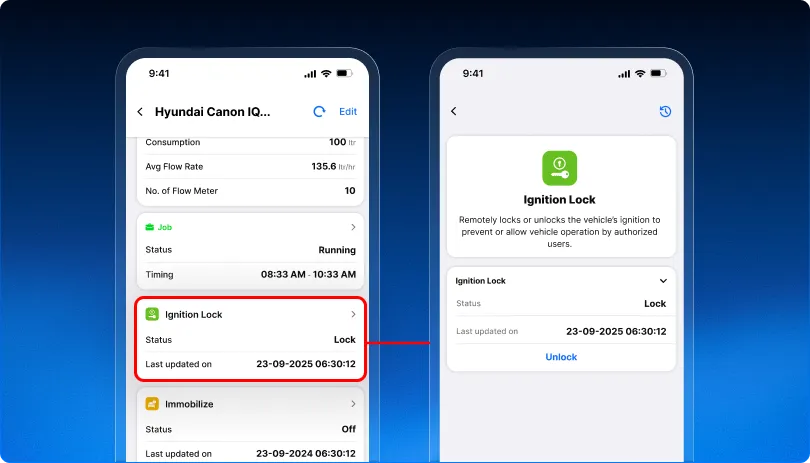
- Use the same ignition controls from the mobile application.
- View Ignition lock history to check previous actions, including date and time, user, status, and reason.
 Key benefits
- Helps prevent unauthorized use of EVs.
- Gives operators remote control over vehicle ignition.
- Provides ignition lock visibility directly from live tracking.
- Maintains consistent control across web and mobile.
- Keeps a history of lock and unlock actions for better accountability.
- Reduces the need for physical intervention when securing a vehicle.
Business impact
Remote ignition lock gives fleet operators an additional level of control over EV security. It helps businesses respond faster when vehicle access needs to be restricted, while maintaining a clear record of ignition lock activities for better operational control and accountability.
1.6 Analyze driver and object violations from one report
Driver behaviour analysis can be more useful when teams can review violations from different perspectives. While driver-wise data helps understand individual driving patterns, object-wise analysis can help identify vehicles associated with frequent violations.
To provide this flexibility, the existing driver violation report has been enhanced to support both driver-wise and object-wise filtering and is now renamed as the driver-object performance report.
What’s updated
The report now provides object and driver selection options, allowing users to choose how they want to analyze violation data.
Based on the selected filter, the summary report will display the corresponding driver or object information. To support this flexible view, the existing driver field has also been renamed to driver / object.
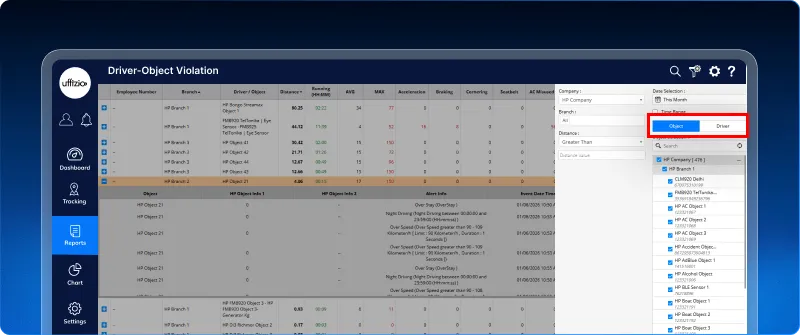 The same changes are reflected across XLS, CSV, and PDF downloads as well as scheduled reports, ensuring consistent information across all report formats.
Key benefits
- Analyze violations based on either drivers or objects.
- Switch between driver-focused and vehicle-focused performance analysis.
- Identify objects associated with frequent driving violations more easily.
- Get consistent data across the report view, downloads, and scheduled reports.
- Reduce the need to use separate reports for different violation analysis requirements.
Business impact
The driver-object performance report gives fleet teams greater flexibility in how they investigate driving violations. By allowing the same data to be viewed from either a driver or object perspective, teams can identify performance concerns faster and make more informed decisions around driver behaviour and fleet operations.
1.7 Automate trip classification using geofence entry and exit
Trip classification helps fleet teams understand the purpose and movement pattern of each journey. However, relying on manual classification or fixed time schedules can require additional effort and may not always reflect how vehicles actually move between locations.
Trakzee now introduces geofence-based trip classification, allowing trips to be automatically classified based on their start and end geofences.
What’s updated
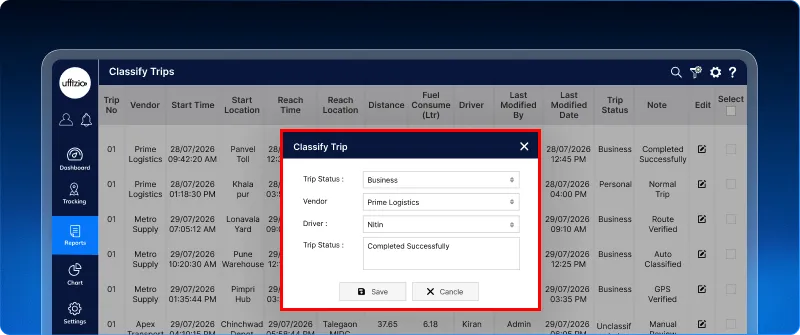
A new classification mode is now available under schedule trip classification. Users can choose between the existing time-based method and the new geofence-based method.
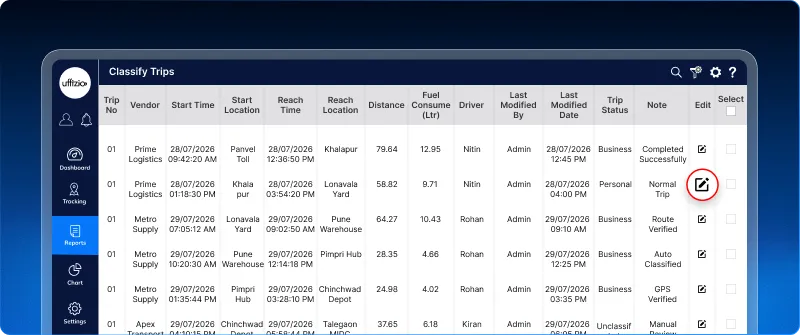 With geofence-based classification, users can configure one or multiple start and end geofences. When a vehicle travels from the configured start geofence to the end geofence, Trakzee automatically applies the selected trip classification.
The trip classification detail report has also been enhanced to show the start geofence, end geofence, and classification mode. This makes it easier to identify whether a trip was classified through geofence in-out, schedule time, or manual classification.
 Key benefits
- Automatically classify trips based on actual vehicle movement.
- Reduce dependency on manual trip classification.
- Configure multiple start and end geofences for greater flexibility.
- Support trips between the same or different geofences.
- Clearly identify how each trip was classified in reports.
- Continue using existing time-based classification whenever required.
Business impact
Geofence-based trip classification makes trip management more automated and location-driven. By classifying journeys based on where vehicles actually start and end their trips, fleet teams can reduce manual work, improve classification consistency, and gain a clearer understanding of vehicle movement across operational locations.
1.8 Monitor vehicle inactivity inside critical geofences
A vehicle becoming inactive does not always mean the same thing. When it happens inside a remote, restricted, or high-risk location, teams may need to pay closer attention. Without location context, however, it can be difficult to understand which inactive vehicles require immediate attention.
Trakzee now enhances the existing inactive alert with geofence-based conditions, helping teams focus on vehicle inactivity occurring within locations that matter to their operations.
What’s updated
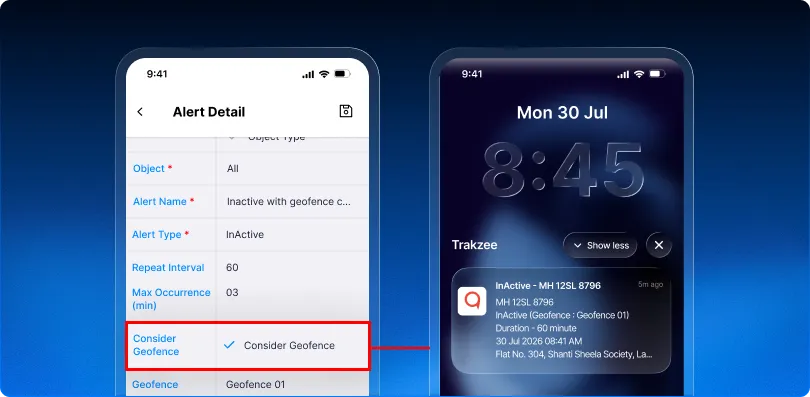
A new consider geofence option is now available while configuring an inactive alert on web and mobile.
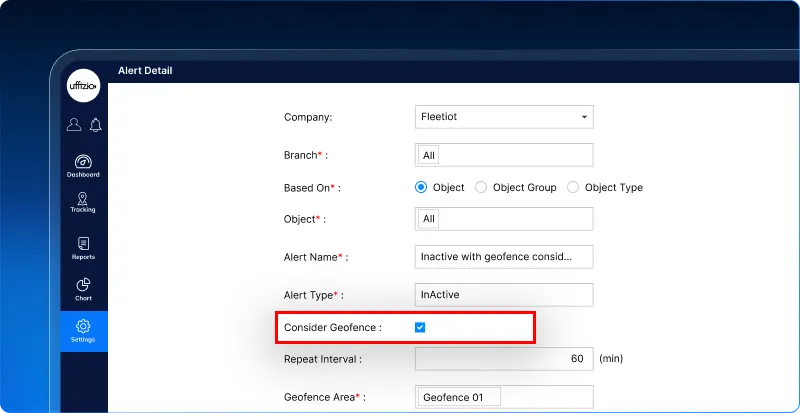 When enabled, users can select one or multiple geofences. The alert will then trigger only when the vehicle becomes inactive within one of the selected geofences for the configured inactivity duration.
The generated alert also includes the geofence name, giving users immediate location context when reviewing the notification.
If the consider geofence option is disabled, the existing inactive alert continues to work as before.
 Key benefits
- Monitor vehicle inactivity specifically within critical locations.
- Select multiple geofences based on operational requirements.
- Reduce unnecessary inactive alerts outside selected areas.
- Get geofence information directly within the alert.
- Identify potentially important inactivity events more quickly.
- Continue using the existing Inactive Alert without changing current configurations.
Business impact
Adding geofence conditions makes Inactive alerts more relevant to location-sensitive operations. Fleet teams can focus their attention on vehicles that lose communication within important or high-risk areas, helping them investigate potential issues faster while reducing unnecessary alert noise.
1.9 Raise emergency alerts instantly from the Driver App
In an emergency, every second matters. Drivers need a quick way to ask for help without navigating through multiple screens or making a call. Trakzee’s Driver App now introduces an emergency SOS option that allows drivers to immediately notify their fleet manager when they need assistance.
What’s added
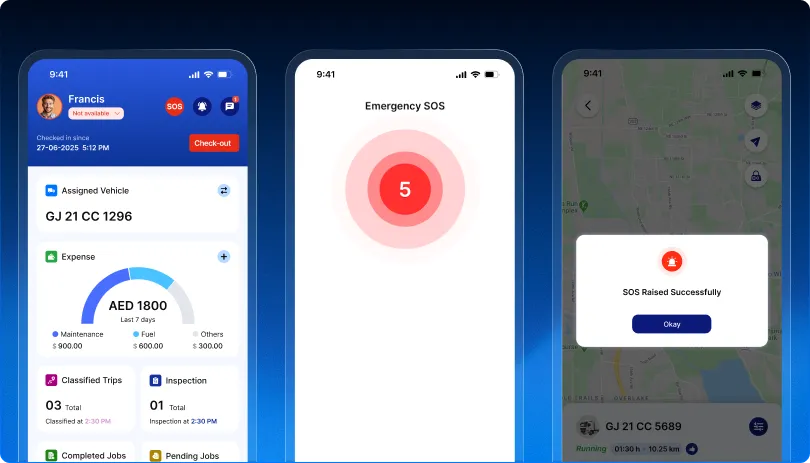
A dedicated SOS button is now available in the Driver App header, positioned near the check-out option for quick and easy access.
When the driver taps the SOS button:
- A 3-second countdown begins before the alert is sent.
- The driver can cancel the SOS during the countdown in case it was triggered accidentally.
- If not cancelled, the SOS alert is sent automatically.
- The driver receives a confirmation once the emergency alert has been successfully sent.
- The manager receives the SOS notification along with relevant driver and location details.
- The SOS event is recorded in the system for tracking.
 The SOS option is designed to remain easily accessible without requiring the driver to navigate away from the main screen.
Key benefits
- Enables drivers to raise an emergency alert with a single tap.
- Helps managers respond faster to drivers who may need assistance.
- Reduces accidental alerts with a 3-second cancellation window.
- Provides driver and GPS location details for better situational awareness.
- Keeps a record of SOS events for future tracking and reference.
- Supports emergency communication across both web and mobile manager interfaces.
1.10 Monitor dumper and tipper tilt activity more effectively
For dumpers, tippers, and heavy construction vehicles, knowing the vehicle’s tilt angle can provide important operational and safety insights. Raw inclinometer readings alone, however, can be difficult to interpret during day-to-day fleet monitoring.
Trakzee now integrates tilt sensor data, converting raw angle readings from the vehicle’s inclinometer into meaningful, colour-coded statuses such as flat, tilting, tilted, and critical. The information can be monitored through live tracking and analyzed using dedicated reports.
A tilt sensor, or inclinometer, measures the angle or inclination of a vehicle or equipment relative to its normal position.
What’s updated
Administrators can now configure a Tilt (Angle) sensor for a vehicle and define angle ranges with corresponding status labels and colours. A multiplication factor can also be configured to convert the raw sensor value into the actual tilt angle.
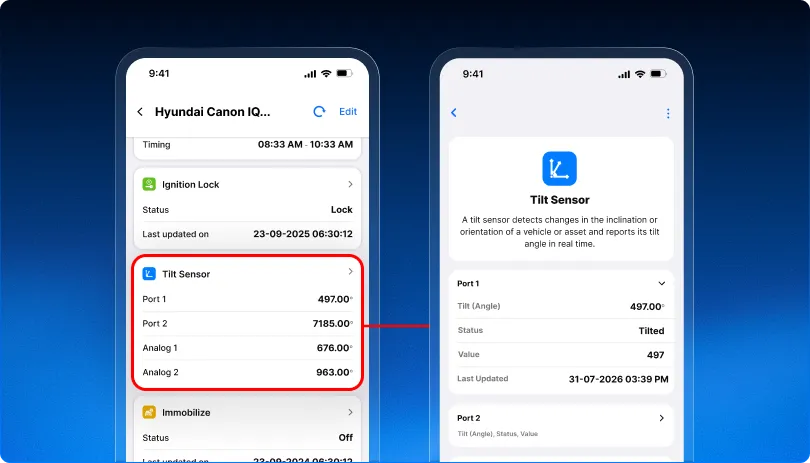 Once configured, users can:
- View the current tilt angle and its status from live tracking.
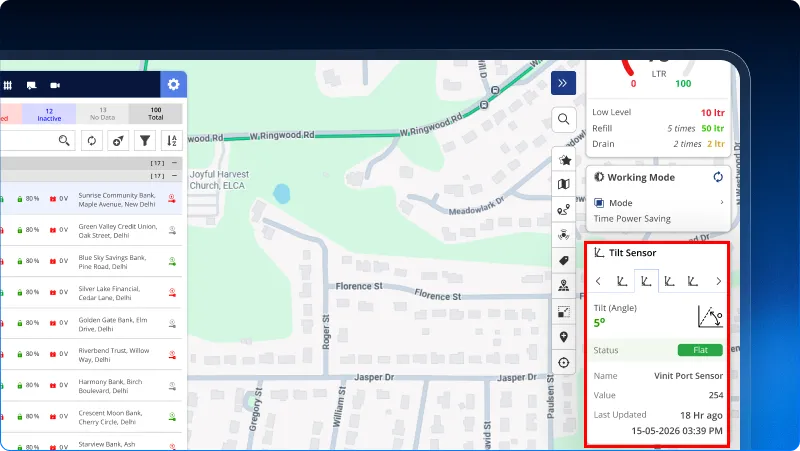
- Quickly understand tilt severity through colour-coded statuses.
- Monitor multiple tilt sensors when more than one tilt port is configured.
- Identify stale sensor data when the latest reading has not been received within the configured duration.
- Use the tilt summary report to review vehicle-wise tilt events, total tilt duration, and maximum recorded angle.
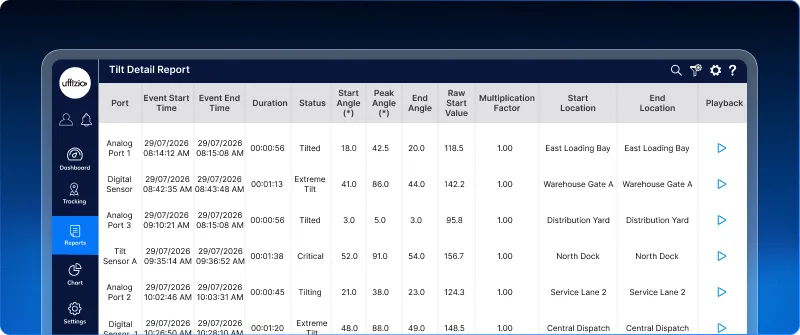
- Use the tilt detail report to investigate individual tilt events with start and end times, duration, status, angles, and locations.
- Export tilt information in XLS and PDF formats for further analysis.
Key benefits
- Provides real-time visibility into vehicle and equipment inclination.
- Helps identify critical or unusual tilt conditions quickly.
- Converts technical sensor readings into easy-to-understand operational statuses.
- Supports better monitoring of dumpers, tippers, and heavy equipment.
- Provides historical tilt data for incident investigation and operational analysis.
- Makes tilt patterns easier to analyze through dedicated summary and detailed reports.
Business impact
Tilt sensor integration gives fleet teams better visibility into how heavy vehicles and equipment are positioned and operated. By combining real-time tilt monitoring with historical reporting, businesses can identify unusual tilt conditions faster, investigate events with greater context, and improve operational oversight of specialized vehicles and equipment.
1.11 Pre-job inspections now connected with job approval
Before a vehicle starts an assigned job, confirming that it is ready for operation can help reduce avoidable risks and strengthen compliance. Trakzee now introduces a Pre-Job Inspection Approval workflow that connects vehicle inspection directly with job execution.
What’s added
While creating a job, users can now enable the required pre-job inspection option. When enabled, the assigned driver must complete a pre-job vehicle inspection before starting the job.
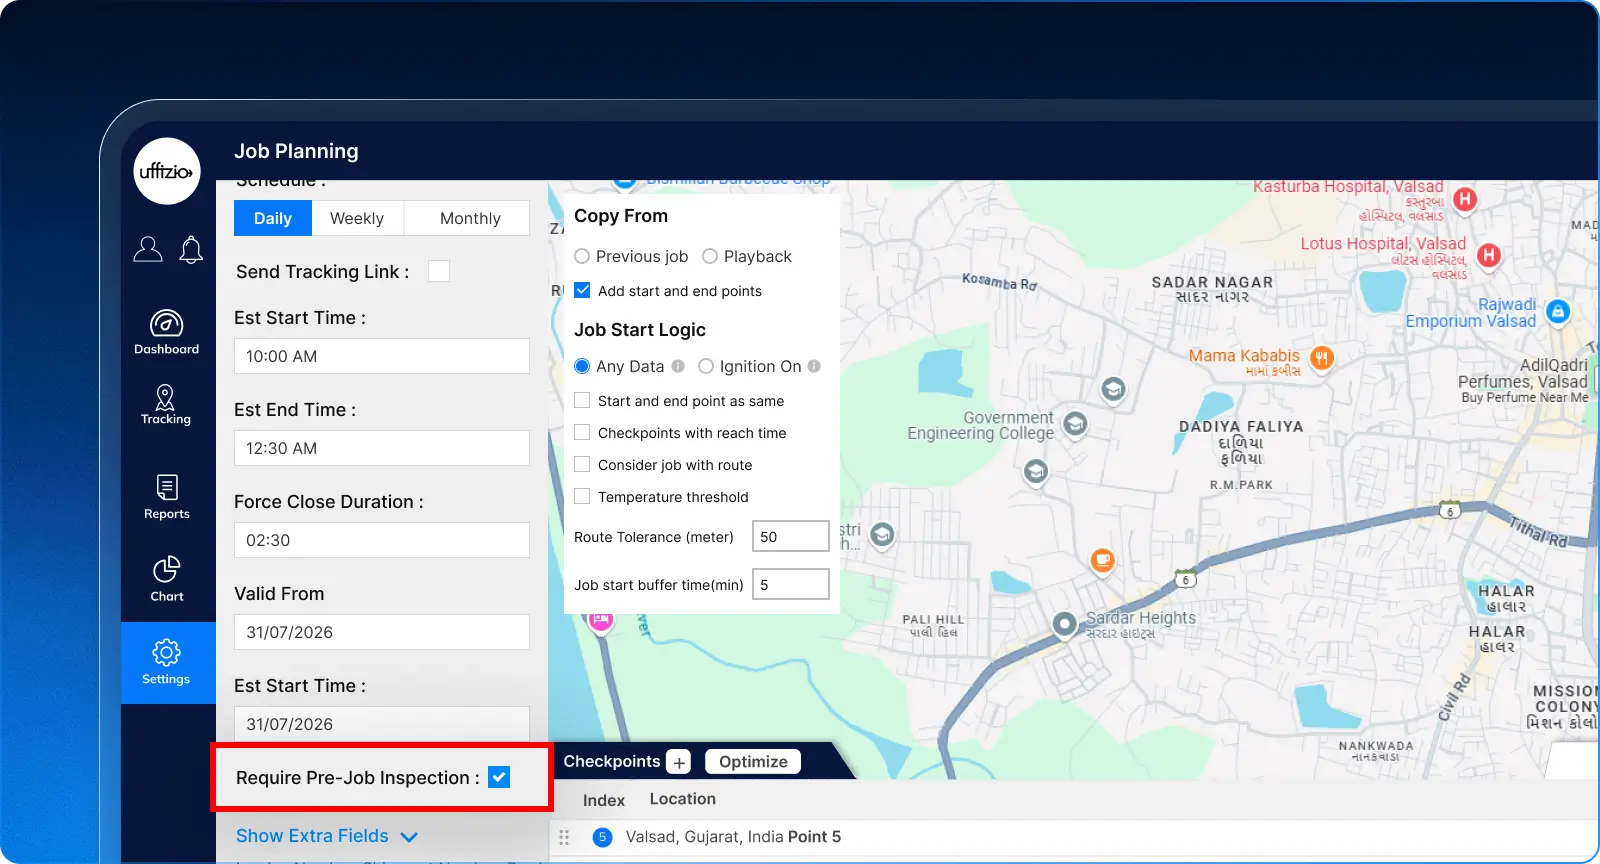
Once the inspection is submitted, the job remains in upcoming status until an authorized user reviews and approves it. The driver can start the job only after approval.
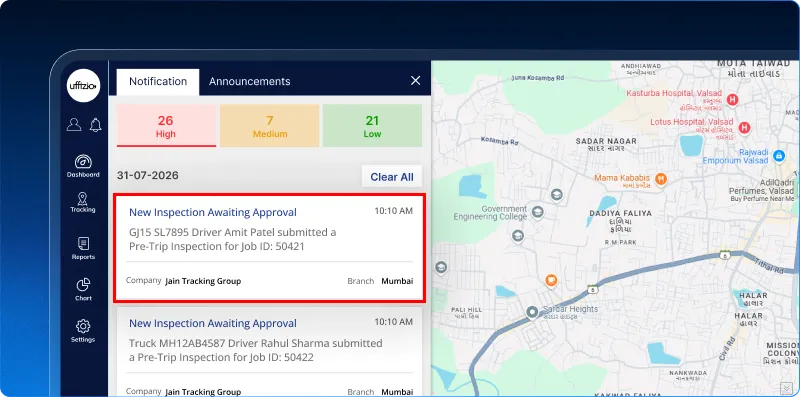 How does it work
- Create a job and enable require pre-job inspection.
- The driver receives an inspection prompt when accessing the job.
- The inspection form automatically picks up the assigned vehicle and sets the inspection type to Pre.
- After submission, the job remains locked while the inspection is pending approval.
- An authorized user can review the complete inspection and approve or reject it.
- If approved, the driver is notified and can start the job.
- If rejected, the driver receives the reason and must complete a new inspection before the job can begin.
Better visibility for drivers
The Driver App displays clear inspection status indicators on the job card, including inspection required, pending approval, approved, and rejected resubmit. This makes it easier for drivers to understand exactly what action is required before starting a job.
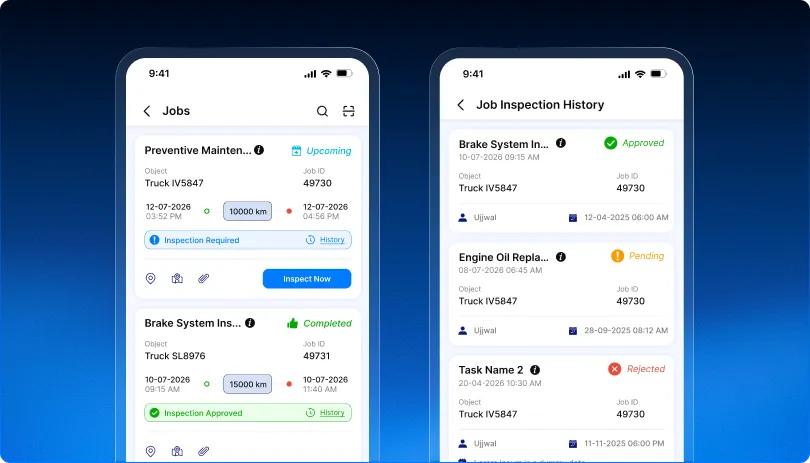 Inspection history and audit trail
Every inspection submission, approval, and rejection is recorded along with details such as the job, driver, vehicle, submission time, approver or rejector, status, and rejection reason. Multiple inspection attempts are also retained, creating a clear history for compliance and audits.
Key benefits
- Helps ensure vehicles are inspected before starting critical jobs.
- Prevents job execution until the required inspection is approved.
- Gives fleet teams better control over vehicle readiness.
- Provides drivers with clear approval and rejection notifications.
- Maintains inspection records for compliance and audits.
- Supports role-based approval so only authorized users can approve or reject inspections.
- Creates a more controlled and accountable job execution process.
Business impact
By connecting pre-job inspections directly with job approval, Trakzee helps businesses move from simply recording inspections to actively enforcing them. Fleet teams gain greater control over vehicle readiness, while drivers receive a clear workflow to follow before every inspection-required job begins.
1.12 Get video evidence for geofence visits in just a few clicks
When reviewing a geofence visit, users may need video evidence to understand what happened when a vehicle entered or exited a location. Earlier, accessing this footage required users to move to live tracking, adding extra steps to the investigation.
Trakzee now allows users to request, view, and download short video clips directly from the geofence visited summary report, keeping location and video evidence together in one workflow.
What’s updated
The detailed view of the geofence visited summary report now includes playback and request video options.
When users select request video, a window opens with the relevant entry-exit timing. Users can request a video clip of up to 2 minutes for the required timestamp.
For vehicles with multiple camera channels, users can select the required channel before requesting the video. If only one channel is configured, it is selected automatically.
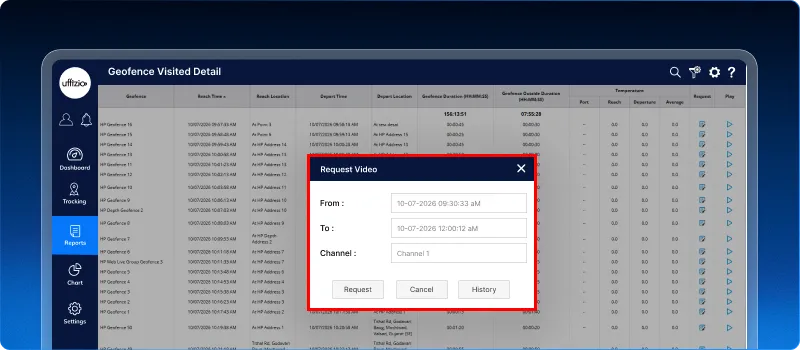 Once the request is submitted:
- If the video is available, it opens directly in the video player with the existing playback controls.
- Users can play or download the requested clip.
- If the video is unavailable, the system displays the relevant message.
- The History option lets users review previous requests along with their time, channel, status, user, and request time.
- Video requests are available only to users with the required video access permissions.
Key benefits
- Access video evidence directly while reviewing geofence visits.
- Reduce the need to switch between reports and live tracking.
- Request precise video clips of up to 2 minutes.
- Select the required camera channel for multi-channel devices.
- View and download video evidence from the same workflow.
- Track previous video requests through request history.
- Speed up investigation and verification of geofence-related activities.
Business impact
By bringing video requests directly into the geofence visited report, Trakzee connects location records with visual evidence in a single workflow. Fleet teams can investigate geofence visits faster, verify activities around important locations, and access relevant footage with fewer steps.
2. Smart Waste updates
2.1 Find the nearest vehicle when you need a quick change
When a vehicle needs to be swapped mid-job, having the closest option ready to go makes all the difference.
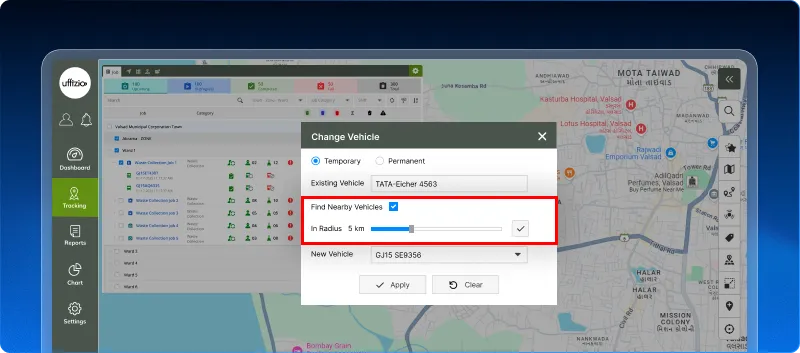
The change vehicle screen now offers a “Find Nearby Vehicles” option built for exactly that. Turn it on, and a distance slider appears anywhere from 1 KM to 15 KM, starting at 5 KM by default. The vehicle list narrows down instantly to just the vehicles within that distance from the job location.
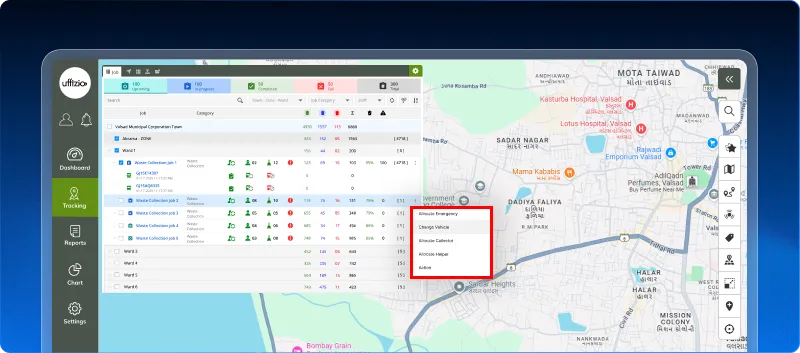 Prefer to see the full list? Leave the option off, and every vehicle shows up, just as it always has.
A search box makes it quick to find a vehicle by name, whichever view is active. Once the right vehicle is found, it can be assigned temporarily for the job, or permanently with a quick confirmation once the change is done.
 What this enables
- See only nearby vehicles, without scrolling through the full list
- Pick the search distance, from 1 KM to 15 KM
- Search vehicles by name within the current list
- Assign a vehicle temporarily or permanently, same as always
Why this matters
- Speeds up decisions when a quick vehicle change is needed
- Puts the closest, most practical option front and center
- Keeps things exactly the same for teams who don’t need the extra step
- Uses the vehicle and GPS data already in the system nothing extra to set up
Also in this release: the menu option “job using missed” has been renamed to “create missed points job” for better clarity.
2.2 Know when a complaint is being worked on, not just open or closed
Complaints move through stages before they’re resolved, and letting citizens know where things stand matters just as much as resolving the issue itself. A citizen who knows their complaint is being handled is a lot more patient, and a lot less likely to call in asking for an update.
What’s added
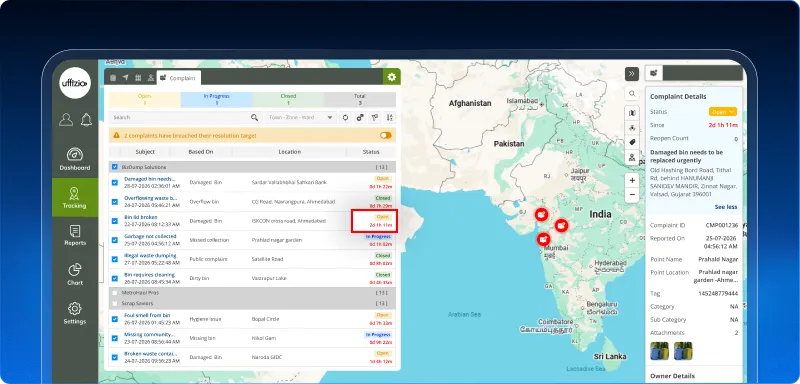
Complaints can now carry a new “in progress” status, sitting between open and closed. A manager can move a complaint through open, then in progress, then closed or straight from open to closed, whichever fits the moment.
This status shows up everywhere the complaint appears: the live tracking list, the complaint detail panel, the complaint summary report, the manager app, and the citizen app. The moment a complaint moves to in progress, the citizen is notified automatically, through SMS or social media, based on what’s set up for that town.
 What this enables
- Show citizens that their complaint is actively being handled
- Track work-in-progress separately from untouched complaints
- Keep the option to close a complaint directly, when needed
Why this matters
- Builds citizen trust and cuts down “is anyone looking at this?” follow-ups
- Gives managers a clearer picture of what’s actually being worked on
- No disruption to the existing open-to-closed flow
2.3 See the linked job right where you’re already working
Every complaint that needs a job gets one linked to it, and having that information visible right alongside the complaint saves a lot of back-and-forth. Managers can see everything about a complaint, including the job tied to it, without leaving the screen they’re already on.
What’s added
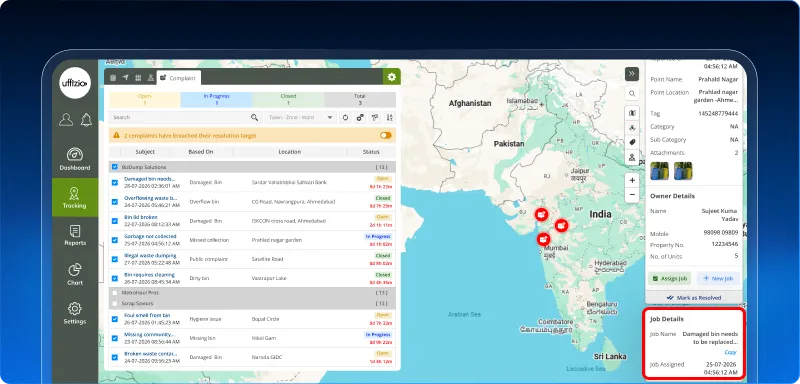
The complaint detail panel now includes a job widget that appears the moment a job is linked, showing the job name (with a quick copy button), the time it was assigned, and its current status.
From this same screen, managers can also monitor the job directly, without moving to a separate job monitoring page.
 What this enables
- Instantly see if a job is already linked to a complaint
- Copy the job name for use elsewhere
- Track the job’s progress without leaving the complaint screen
Why this matters
- Prevents duplicate jobs being created for the same complaint
- Saves time switching between screens
- Gives a complete view of the complaint and its job in one place
2.4 Give a complaint one genuine second chance
Once a complaint is closed, that’s usually the end of it. If the issue comes back, the citizen has to file a brand-new complaint, with no link to the original one and no record of what was already tried.
Now, a closed complaint can be reopened, once.
What’s added
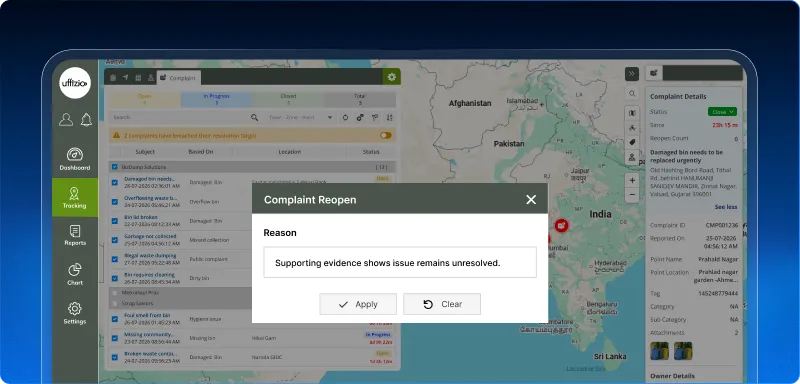
A manager can reopen a closed complaint. The system asks for confirmation first, then asks for a reason: issue persists, incomplete resolution, wrongly closed, or other.
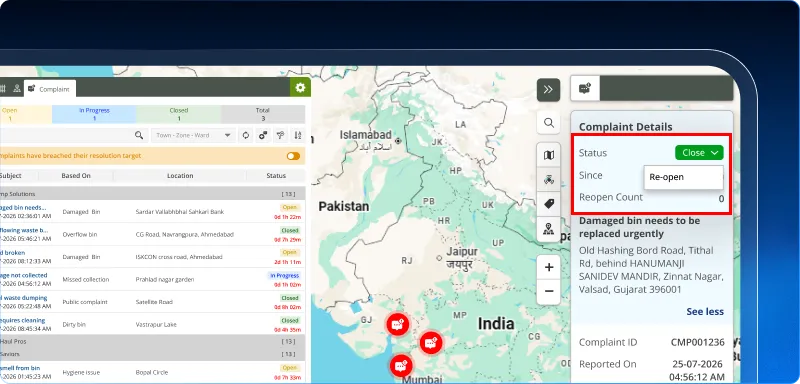 Once confirmed, the complaint moves back to open and its response timer (the clock that tracks how long a complaint takes to resolve) restarts from that moment. The citizen is notified automatically.
Each complaint can only be reopened once. If someone tries a second time, the system shows a clear message and offers a “register new complaint” button, with the subject and location already filled in from the original complaint.
 What this enables
- Reopen a closed complaint if the issue isn’t actually resolved
- Capture a clear reason every time a complaint is reopened
- Quickly raise a fresh complaint, pre-filled, when a second reopen isn’t allowed
Why this matters
- Reduces citizen frustration over issues that come back
- Keeps a clear, honest record of why a complaint was reopened
- Prevents repeated back-and-forth, while still leaving an easy path forward
2.5 Track reopened complaints in every report
Once a complaint goes through a reopen, there was no way to see that it happened or how long the second round took, without digging manually.
Now, that information is built right into the reports.
What’s added
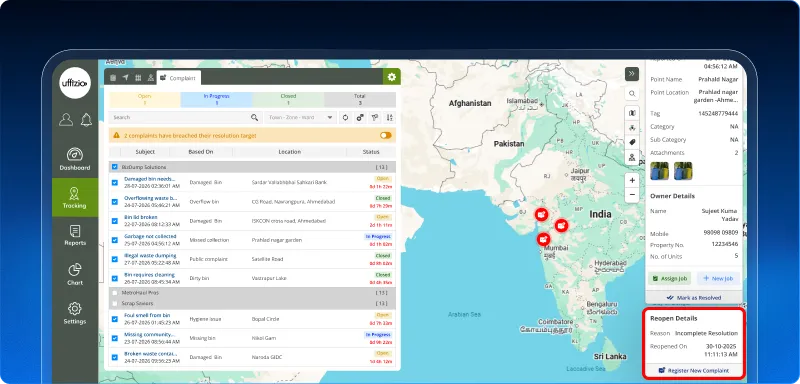
The complaint detail panel now shows a “Reopen Details” section (only if the complaint was reopened), with the reopen date, the reason, the reclose date, and how long the reopen phase took to resolve.
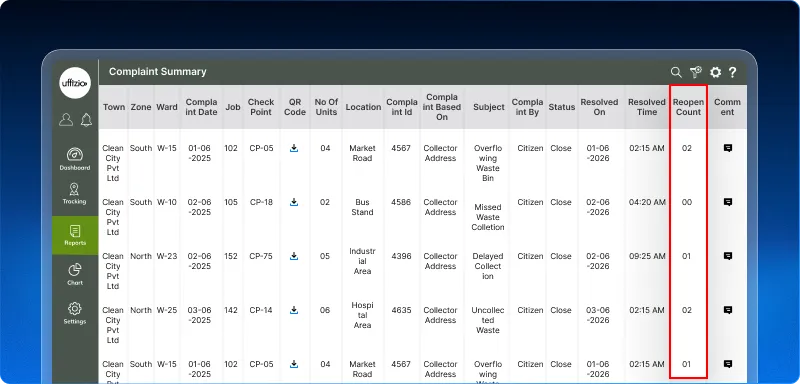
 The complaint summary report gets a new “Reopen Count” column: 0 for never reopened, 1 for reopened once, and a dash for complaints still open. Clicking into a reopened complaint shows the same reopen details. This is also available in the manager app, including resolution time and resolved on in the card view, and all of it carries over into Excel, PDF, and scheduled report exports.
 What this enables
- See at a glance which complaints were reopened, and why
- Check how long the reopen phase took to resolve
- Get the same details in every export and scheduled report
Why this matters
- Makes it easy to spot complaints that needed a second attempt
- Supports better audits and performance reviews
- Keeps reporting consistent across web and mobile
2.6 See what still needs attention, not what’s already done
Every time the complaint screen loads, it’s easy for an old but still-unresolved complaint to get buried under newer ones, or for the screen to feel cluttered with complaints that were closed long ago.
Now, the screen loads with a smarter default.
What’s added
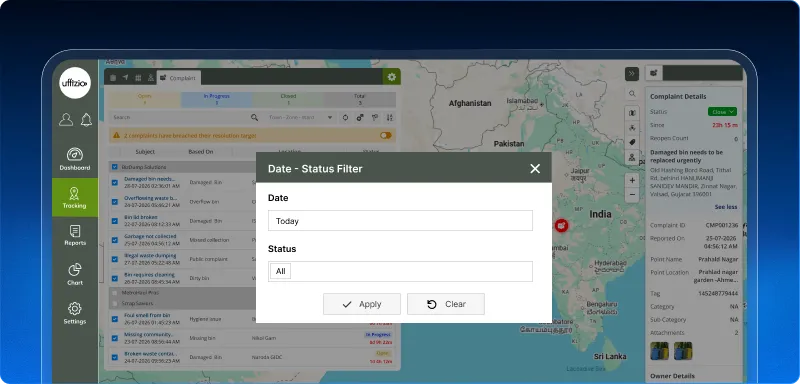
Every time the complaint tab is opened, all open and in progress complaints show up, no matter how old they are. Closed complaints only show from the last 7 days by default. Older closed complaints are still just one date filter away.
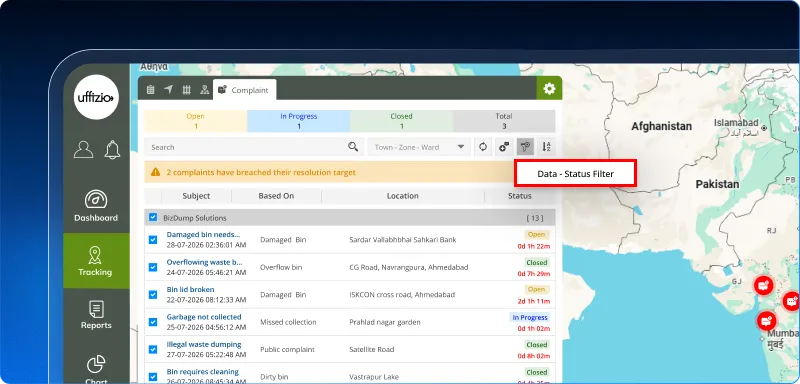
The complaint list has also been enhanced with smarter filtering and better visibility.
Managers can now:
- Filter complaints using predefined date ranges such as Today, Yesterday, This Week, Last Week, This Month, and a Custom Date Range.
- Filter by complaint status including Open, In Progress, Closed, or All.
- Combine both date and status filters for quicker searches.
- View complaint age in an easy-to-read duration format.
- Review complaint details in an improved right-side panel.
- Read long complaint descriptions more comfortably with automatic See More / See Less support.
 What this enables
- See every complaint that still needs action, regardless of age
- Keep the default view focused, without old closed complaints cluttering it
- Pull up older closed complaints anytime, using the existing filter
Why this matters
- Nothing pending gets missed just because it’s old
- Keeps the daily working view clean and relevant
- No extra clicks needed for the complaints that matter most
2.7 Choose your own checkpoint tolerance for every job
Every collection job checks whether a vehicle actually reached a checkpoint (a stop it was supposed to service), using an allowed distance called the checkpoint tolerance.
Earlier, this tolerance was set once at the town level and applied to every job in that town. But not every job is the same a job in a tight urban lane may need a smaller tolerance, while one spread across a rural stretch may need more room. There was no way to set this differently for individual jobs.
Now, that flexibility is here.
What’s added
A new “consider checkpoint tolerance” checkbox has been added to the Rule tab while creating a job. It’s off by default.
Turn it on, and two options appear “town configured” (selected by default) or “custom”:
- With town configured, the job automatically uses the tolerance already set for that town. This value shows up on its own and can’t be edited here. If the town doesn’t have a tolerance set up, the system shows a message and won’t allow the job to be saved with this option.
- With custom, a tolerance value can be entered directly, anywhere between 10 and 100 meters.
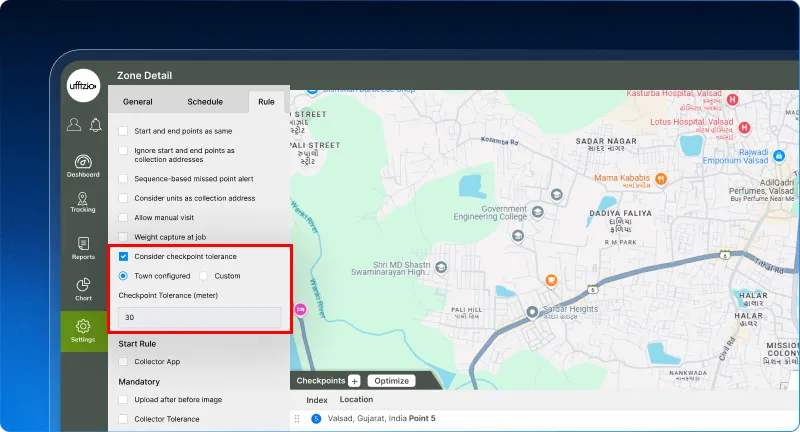 This choice can only be made while creating a job, not changed afterward. When a job is copied, its tolerance setting, along with its value, carries over automatically.
If the town’s tolerance changes later, every job still on town configured mode picks up the new value on its own. Jobs set to custom stay exactly as they were, unaffected by any town-level change. Jobs created before this update keep working exactly as they do today, no changes needed.
What this enables
- Choose between the town’s tolerance or a custom value, for each job
- Set a custom checkpoint distance between 10 and 100 meters, when needed
- Let Town Configured jobs stay automatically updated if the town’s tolerance changes
- Keep Custom jobs stable, unaffected by any town-level updates
- Carry the tolerance setting over automatically when a job is copied
Why this matters
- Gives more control over checkpoint accuracy across different job types and areas
- Removes the need to apply one tolerance value to every job in a town
- Keeps all existing jobs working exactly as before, with no manual rework
- Reduces the chances of missed or wrongly validated checkpoints in mixed urban-rural operations
2.8 Correct any checkpoint, right when you need to
Field data does not always tell the full story. A checkpoint may be marked as missed even though collection was completed, or the recorded collector, vehicle, or status may need correction due to operational changes. SmartWaste now gives managers a controlled way to correct such checkpoint information directly from live tracking.
What’s added
Managers can now override checkpoint information directly from the live tracking screen for running and completed jobs. The feature can be enabled at the town level through the Job Rule configuration, giving organizations control over where checkpoint overrides are allowed.
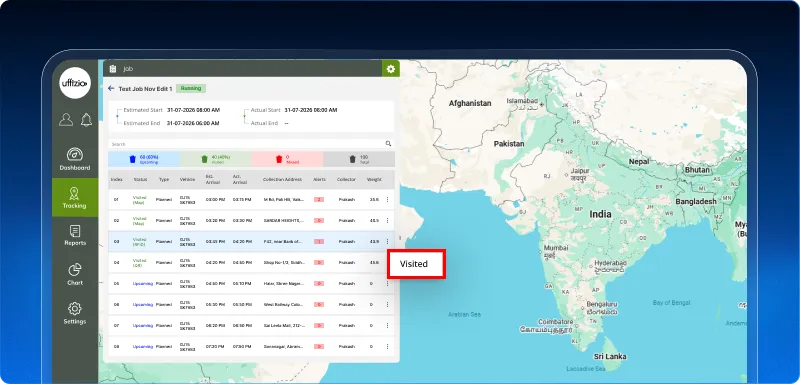 With this enhancement, managers can:
- Change a checkpoint status to upcoming, visited, or missed.
- Update the collector and vehicle when changing the status to visited or missed.
- Adjust the checkpoint timestamp when required.
- Add a mandatory reason for every correction.
- Review and confirm the change before it is applied.
- See the updated checkpoint status, map pin, and job summary counts immediately in Live Tracking.
- Reflect the corrected information automatically in operational reports.
- Override each checkpoint only once to maintain controlled data correction.
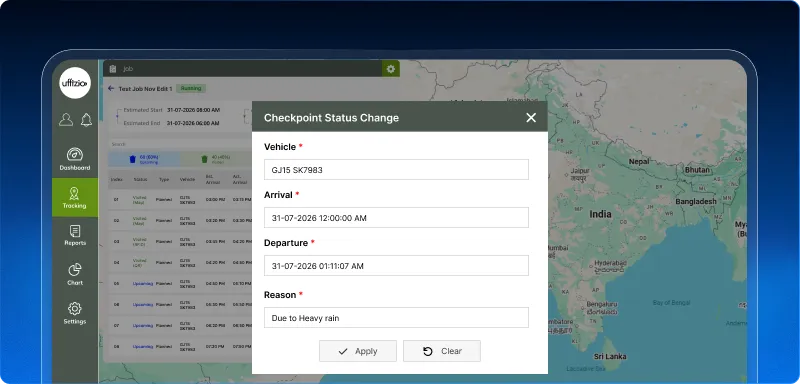 The original checkpoint record is preserved separately, while the corrected record becomes the effective information used across live tracking and reports. This provides flexibility to correct genuine operational discrepancies without losing the original activity history.
Key benefits
- Correct inaccurate checkpoint records without creating a new job or using manual workarounds.
- Keep live tracking and operational reports aligned with actual field operations.
- Maintain a clear audit trail of original and corrected information.
- Handle vehicle or collector changes more accurately during ongoing operations.
- Improve the reliability of collection performance and service records.
- Keep override access controlled through town-level configuration.
Business impact
This enhancement gives supervisors greater control over operational data while keeping every correction accountable. Municipal teams can resolve field-data discrepancies faster and maintain more reliable collection records for monitoring, reporting, and service verification.
2.10 Keep collectors updated on vehicle reassignment
Vehicle assignments can change even after a collection job has been planned or started. While managers could already reassign vehicles for upcoming and running jobs, collectors were not automatically informed about these changes, which could lead to confusion during job execution.
SmartWaste now introduces a vehicle changed notification to keep collectors informed whenever the vehicle assigned to their job is updated.
What’s updated
Whenever a manager successfully changes the assigned vehicle for an upcoming or running job, the respective collector now receives a notification directly in the mobile application.
The notification provides:
- The relevant job name or job ID.
- The previously assigned vehicle.
- The newly assigned vehicle.
- Clear confirmation that the vehicle assignment has changed.
For example:
Vehicle changed
The vehicle assigned to Job [Job Name/Job ID] has been changed from [Old Vehicle] to [New Vehicle].
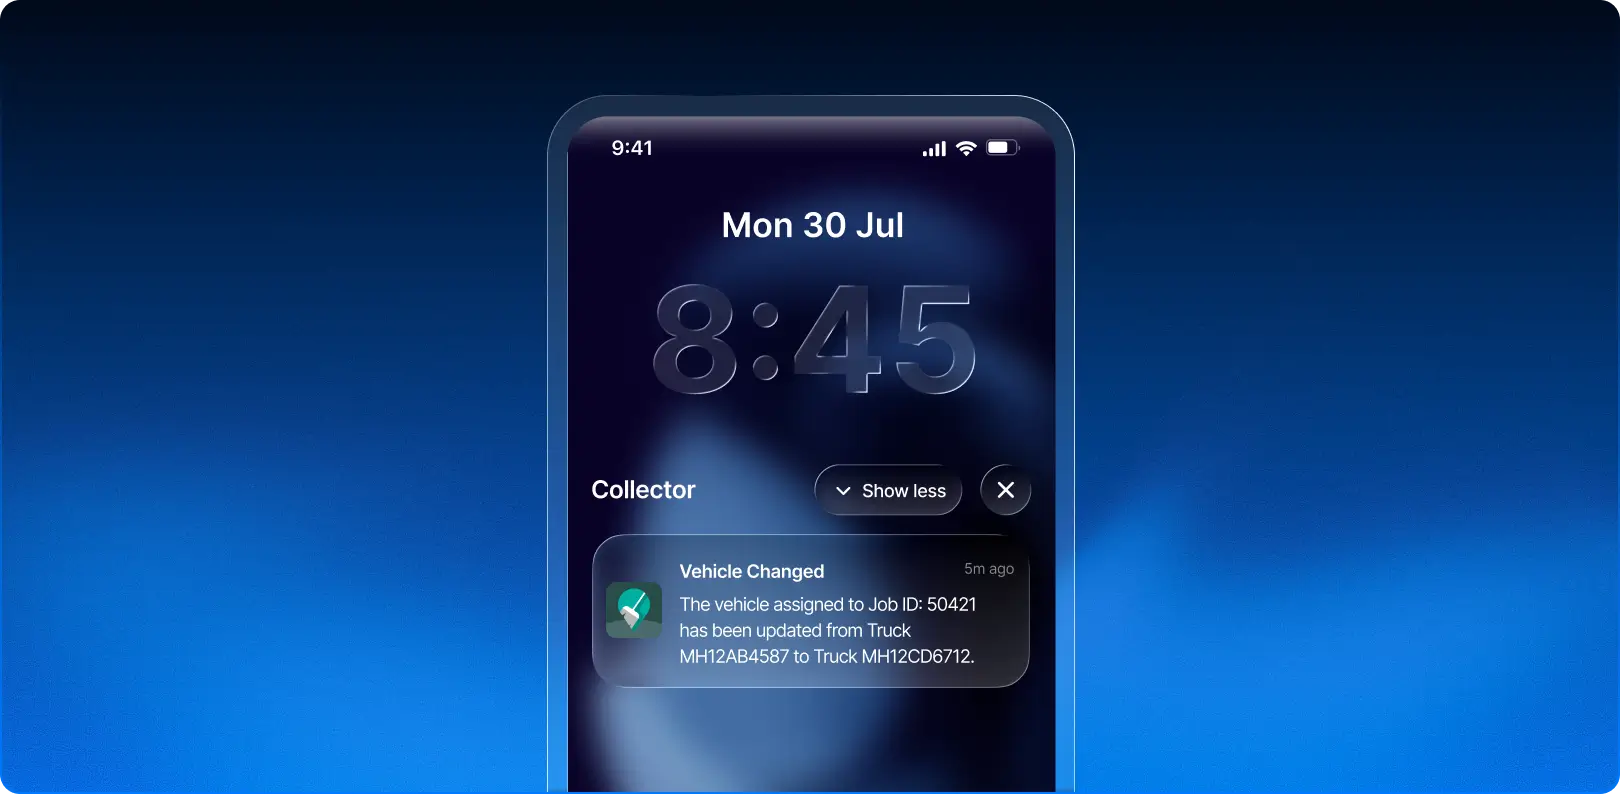 The new notification template is also available through the existing notification management settings, allowing it to be configured and enabled as required.
Key benefits
- Keeps collectors immediately informed about vehicle reassignments.
- Reduces confusion during active collection operations.
- Improves coordination between managers and field teams.
- Helps collectors continue jobs using the correct assigned vehicle.
- Uses the existing notification management system for easy configuration.
- Supports smoother job execution when operational changes occur.
Business impact
With automatic vehicle change notifications, managers and collectors stay aligned even when assignments change at short notice. This helps reduce communication gaps, prevents vehicle-related confusion in the field, and supports more coordinated waste collection operations.
2.11 Track recurring missed checkpoints with overdue insights
A missed checkpoint can be a daily exception, but when it remains unserviced for several days, it can become a larger service issue. Finding these recurring gaps through individual jobs and reports can be time-consuming, especially across multiple zones and wards.
SmartWaste now introduces the consistently missed checkpoints widget, giving managers a consolidated view of checkpoints that were missed in completed jobs and continue to remain unserviced.
What’s new
The new consistently missed checkpoints widget brings long-pending collection gaps directly to the SmartWaste dashboard. Instead of reviewing individual jobs, managers can quickly understand how many checkpoints remain unattended and how long they have been overdue.
The widget provides:
- Total count of currently unserviced missed checkpoints.
- 1–2 days overdue checkpoint count.
- 3 days overdue checkpoint count.
- 4+ days overdue checkpoint count.
- A critical percentage indicator for quick severity assessment.
- Trend comparison with the last working day to show whether missed checkpoints are increasing, decreasing, or unchanged.
- Zone and ward filters to focus on specific operational areas.
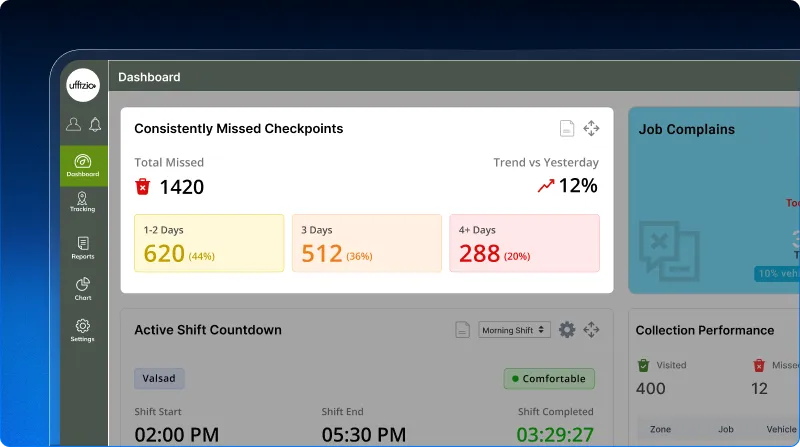 The comparison uses the most recent previous day on which at least one job was completed rather than simply using the previous calendar day. This gives managers a more meaningful operational comparison.
Dig deeper into missed checkpoints
Managers can open the textual view to investigate the checkpoints behind the numbers. It provides details including:
- Zone and ward
- Checkpoint name
- Job name
- Days overdue
The most overdue checkpoints appear first, helping teams prioritize areas requiring attention. The detailed data can also be exported in XLS or PDF format for further analysis and reporting.
Key benefits
- Identify chronic collection gaps that may be missed in daily monitoring.
- Understand the severity of unattended checkpoints based on overdue duration.
- Prioritize the longest-pending checkpoints first.
- Compare current missed collections with the last working day.
- Analyze service gaps at zone and Ward levels.
- Access checkpoint-level details without reviewing individual jobs.
- Export missed checkpoint information for operational reviews and reporting.
Business impact
The consistently missed checkpoints widget moves monitoring beyond simply knowing what was missed today. By showing which checkpoints continue to remain unserviced and for how long, SmartWaste helps supervisors identify recurring service gaps, prioritize corrective action, and improve collection coverage across operational areas.
2.12 Visualize ward-wise collection coverage with a heatmap
When collection operations span multiple wards, numbers in reports do not always make it easy to see where service gaps are happening. Managers often need a faster way to understand which areas are performing well and which require immediate attention.
SmartWaste now introduces the checkpoint coverage heatmap, bringing ward-wise collection progress directly onto the dashboard through an interactive, color-coded map.
What’s updated
The new checkpoint coverage heatmap displays existing ward boundaries on the map and calculates collection coverage for each ward based on the selected period.
Coverage is calculated using the number of visited checkpoints against the total checkpoints assigned through jobs. On-time, early, and delayed visits are all considered as visited checkpoints.
Each ward is then color-coded based on its collection progress:
- Dark green – 100% coverage
- Light green – 90% to 99% coverage
- Amber – 70% to 89% coverage
- Red – 1% to 69% coverage
- Dark red – 0% coverage where jobs were assigned
- Gray – No jobs assigned during the selected period
This makes it easy to distinguish between a ward where collection has not started and a ward where no collection job was planned at all.
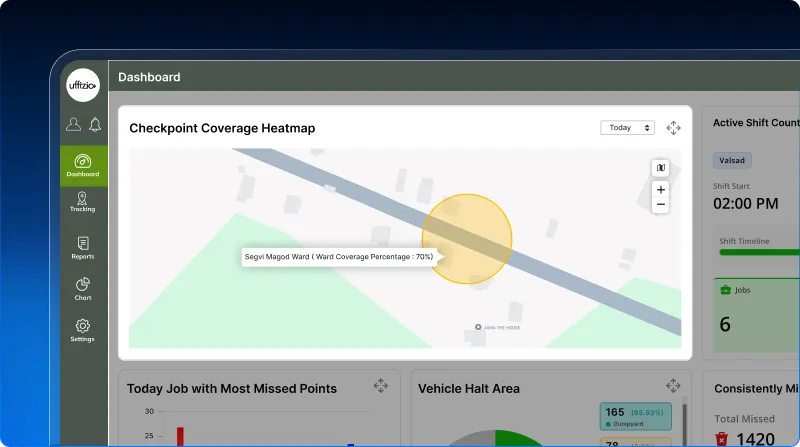 Explore ward-level coverage
Hovering over a ward provides additional operational details, including:
- Ward name
- Coverage percentage
- Total assigned checkpoints
- Total visited checkpoints
- Coverage status
A clear map legend explains each coverage category, helping managers interpret the map without switching to another report.
Analyze coverage across different periods
Managers can review collection coverage using today, yesterday, this week, last week, last 7 days, or a custom range of up to 7 days.
Changing the date automatically recalculates coverage and refreshes the ward visualization, making it easier to compare collection performance across different operational periods.
Key benefits
- Understand collection coverage geographically instead of relying only on reports.
- Spot low-performing wards quickly through color-coded visualization.
- Identify areas with complete, partial, delayed, or zero collection coverage.
- Clearly distinguish 0% coverage from areas where no jobs were assigned.
- View ward-level checkpoint information directly from the map.
- Analyze daily and weekly collection coverage using flexible date filters.
- Help supervisors focus attention on areas where collection coverage needs improvement.
Business impact
The checkpoint coverage heatmap turns collection data into an easy-to-understand geographical view. Instead of reviewing multiple tables to find service gaps, supervisors can immediately see where collection is progressing and where attention is needed, supporting faster operational decisions and more consistent service coverage across wards.
2.13 Track payment collections directly from the dashboard
Payment collection is an important part of waste collection operations, but without dashboard-level visibility, managers may need to rely on detailed reports to understand how much has been collected and how many collection addresses remain unpaid.
SmartWaste now introduces the payment collection widget, giving managers a quick view of collected payments and payment status directly from the dashboard for the period and operational area they want to monitor.
What’s new
The new payment collection widget provides a consolidated view of payment activity for collection addresses. It is available only to users with the required access rights.
The widget displays:
- Total collected amount for the selected period.
- Total number of collection addresses.
- Number of paid collection addresses.
- Number of unpaid collection addresses.
- The active date range for clear context.
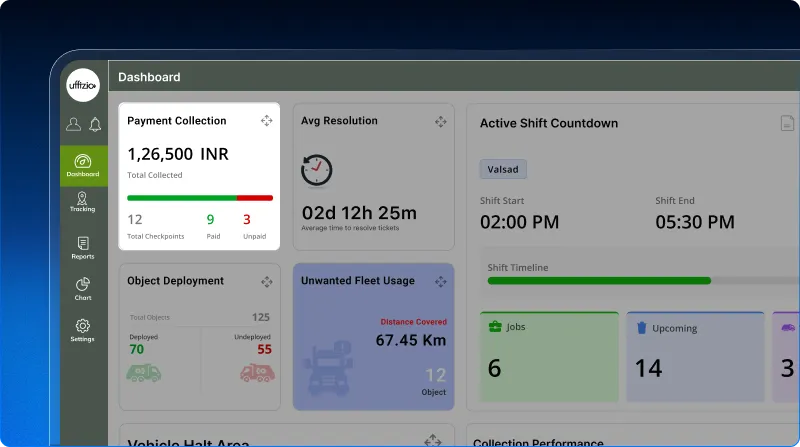 All these metrics follow the same selected period, keeping the payment figures and address counts consistent. The widget also works with the existing town, zone, and ward dashboard filters, helping managers narrow payment information to specific operational areas.
Review payments across flexible date ranges
Since payment collection may follow different billing cycles rather than happening every day, managers can choose from:
- Today
- Yesterday
- This Week
- Last Week
- Last 7 Days
- Custom Range of up to 31 days
Today is selected by default, while the custom option allows managers to choose from and to dates based on their review period. All payment metrics automatically update according to the selected date range.
Explore payment details
Managers can open the textual view to see the individual records behind the dashboard figures. Details include town, zone, ward, collection address, owner name, payment date, payment status, paid amount, total amount, and collector name.
The detailed information supports pagination and can also be exported in XLS and PDF formats for further analysis and reporting.
Key benefits
- Get quick visibility into total payments collected.
- Compare Paid and Unpaid collection address counts from one widget.
- Analyze payment activity across flexible billing periods.
- Monitor payments for specific towns, zones, or wards.
- Access detailed payment records without searching through separate reports.
- Export payment information for reviews and documentation.
- Control access to financial information through user rights.
Business impact
The Payment Collection widget gives waste management teams a faster way to understand collection revenue and payment status across their operations. With flexible date selection, location-based filtering, and detailed records available from the same widget, managers can review payment activity more efficiently and make informed follow-up decisions.
2.14 Manage complaint resolution with configurable SLA targets
Different types of complaints require different response times. Using the same resolution timeline for every complaint makes it difficult to prioritize critical issues and measure service performance accurately.
SmartWaste now introduces configurable Complaint SLAs, allowing administrators to define resolution targets for different complaint subjects and monitor overdue complaints more effectively.
What’s added
Administrators can now configure complaint resolution targets at the town level with subject-specific SLA settings.
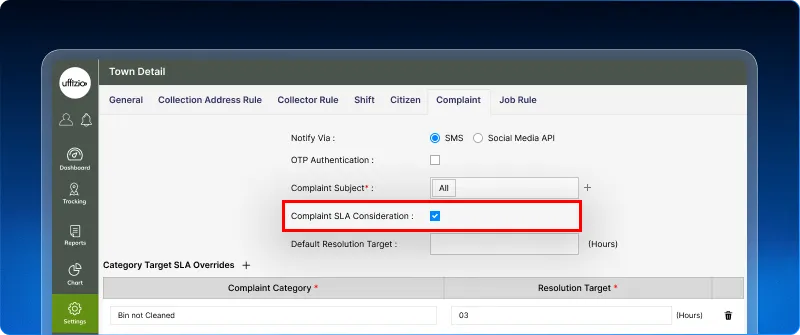 The enhancement includes:
- Enable or disable Complaint SLA for each town.
- Configure a default resolution target.
- Set different SLA targets for individual complaint subjects.
- Automatically use the default target when no subject-specific SLA is defined.
- Display SLA-breached complaint count on the Live Tracking screen.
- Add SLA Target and Exceeded By columns in the Complaint Summary Report, including exports and scheduled reports.
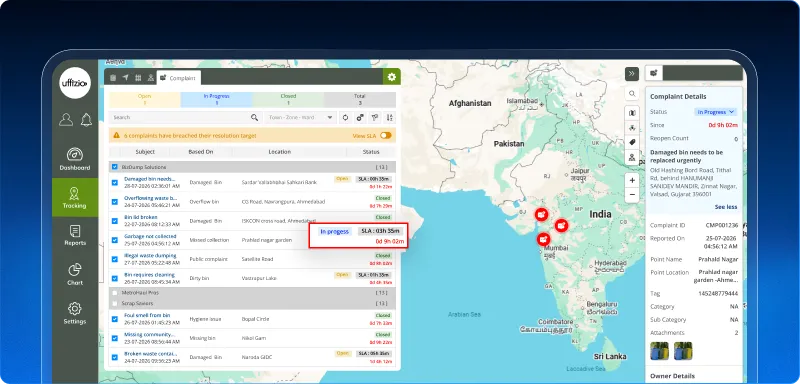 Key benefits
- Define realistic resolution timelines for different complaint types.
- Identify overdue complaints based on configured SLAs.
- Prioritize critical complaints more effectively.
- Improve visibility of complaint resolution performance.
- Track SLA compliance directly from Live Tracking and reports.
Business impact
This enhancement helps municipalities measure complaint resolution against meaningful service standards instead of generic timelines. By introducing subject-wise SLAs and overdue visibility, SmartWaste enables better prioritization, improved accountability, and more efficient complaint management.
2.15 Monitor complaint status with an enhanced dashboard widget
Knowing the total number of complaints is useful, but it doesn’t reveal how many still need attention and how many have already been resolved. Managers often have to open detailed reports just to understand the current complaint status.
SmartWaste enhances the Job Complaints widget by introducing a status-wise breakdown, making it easier to monitor complaint progress directly from the dashboard.
What’s new
The enhanced Job Complaints widget now categorizes complaints based on their current status while retaining all existing widget functionality.
The widget now displays:
- Open complaint count
- In Progress complaint count
- Closed complaint count
- Total complaint count
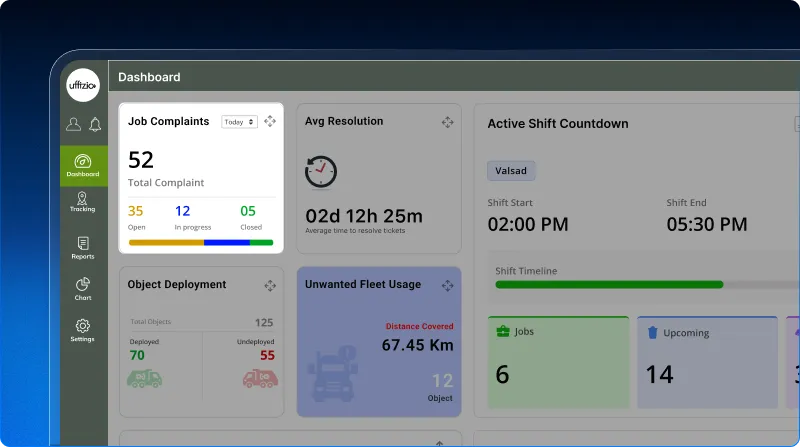 All counts automatically update based on the selected date filter, providing an accurate operational snapshot for the chosen period.
In addition, when users click the Total count to open the Complaint Summary Report, the selected widget date filter is automatically applied. This eliminates the need to manually reselect the same date range after navigating to the report.
Key benefits
- View complaint distribution by status directly from the dashboard.
- Quickly identify pending and resolved complaints.
- Monitor complaint progress without opening multiple reports.
- Automatically carry the selected date filter to the Complaint Summary Report.
- Retain existing complaint creation and widget functionality.
- Improve operational monitoring with a clearer complaint overview.
Business impact
This enhancement transforms the Job Complaints widget from a simple count display into an operational monitoring tool. By providing instant visibility into complaint status and maintaining filter continuity between the dashboard and reports, SmartWaste helps managers review complaint performance faster and make more informed operational decisions.
2.16 Monitor collector revenue with the Top Revenue Collectors widget
Understanding how much revenue each collector generates is essential for evaluating payment collection performance. Earlier, managers had to rely on detailed reports and manual analysis to identify their highest-performing collectors.
SmartWaste now introduces the Top Revenue Collectors widget, making it easy to see the highest revenue-generating collectors directly from the dashboard.
What’s new
The new Top Revenue Collectors widget ranks collectors based on the total Paid Amount collected during the selected period.
The widget includes:
- Top 5 collectors ranked by collected revenue.
- Collector name and total revenue collected.
- Flexible date filters including Today, Yesterday, This Week, Last Week, Last 7 Days, and Custom Range (up to 31 days).
- Automatic updates based on Town, Zone, and Ward filters.
- Rights-based visibility to ensure only authorized users can access the widget.
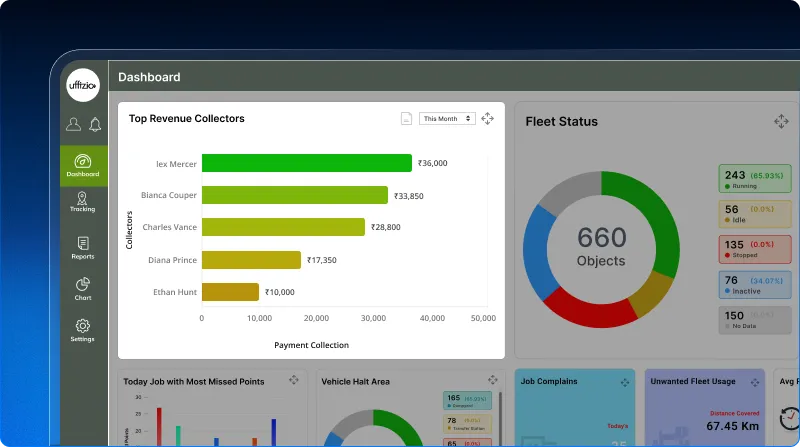 For deeper analysis, users can open the Textual View to review detailed payment records, including collector name, location details, collection address, payment status, payment date, and paid amount. The detailed view also supports XLS and PDF exports.
Key benefits
- Identify the highest revenue-generating collectors instantly.
- Compare collector performance without running multiple reports.
- Analyze revenue across different operational periods.
- Filter rankings by Town, Zone, and Ward.
- Access detailed payment records behind each ranking.
- Export collector revenue details for operational reviews.
Business impact
The Top Revenue Collectors widget gives supervisors immediate insight into collector performance without manual report analysis. By highlighting revenue contribution in a simple ranking view, SmartWaste helps organizations recognize high-performing collectors, monitor payment collection efficiency, and make more informed operational decisions.
2.17 Monitor complaint SLA health from your dashboard
Earlier, SmartWaste introduced configurable Complaint SLAs to help municipalities define resolution targets for different complaint types. Building on that capability, the new Complaint SLA Health widget brings those SLA insights directly to the dashboard, allowing managers to monitor complaint compliance without navigating to the Live Tracking screen.
What’s added
The new Complaint SLA Health widget provides a real-time summary of active complaints based on their SLA status.
The widget displays:
- Total active complaints
- Complaints that have breached their configured SLA
- Complaints that are still within their SLA
- Direct navigation to the Complaint tab for breached complaints
- Textual View with detailed complaint information
- XLS and PDF export support
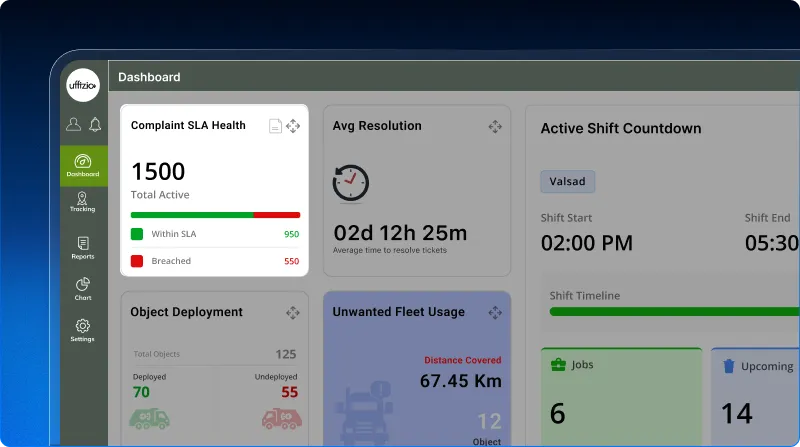 Complaint classification is automatically driven by the existing Complaint SLA configuration, ensuring the dashboard always reflects the latest SLA status.
Key benefits
- Monitor complaint SLA compliance directly from the dashboard.
- Identify SLA-breached complaints without opening Live Tracking.
- Quickly distinguish complaints that require immediate attention.
- Access detailed complaint information through the Textual View.
- Export SLA data for operational reviews and audits.
- Reuse the existing Complaint SLA configuration without additional setup.
Business impact
The Complaint SLA Health widget extends SmartWaste’s SLA management capabilities by providing a dedicated dashboard view of complaint compliance. With real-time visibility into breached and within-SLA complaints, managers can prioritize responses faster, monitor service performance more effectively, and reduce the risk of SLA violations.
2.18 Track top revenue-generating wards with a dashboard widget
Revenue collection can vary significantly across different operational areas. While payment reports provide the necessary data, identifying the highest-performing wards often requires manual filtering and analysis.
SmartWaste now introduces the Top Revenue Wards widget, giving managers an instant view of the wards generating the highest payment collection revenue directly from the dashboard.
What’s added
The new Top Revenue Wards widget ranks wards based on the total Paid Amount collected during the selected period.
The widget includes:
- Top 5 wards ranked by collected revenue.
- Ward name and total revenue collected.
- Flexible date filters including Today, Yesterday, This Week, Last Week, Last 7 Days, and Custom Range (up to 31 days).
- Automatic updates based on Town, Zone, and Ward filters.
- Rights-based visibility to ensure only authorized users can access the widget.
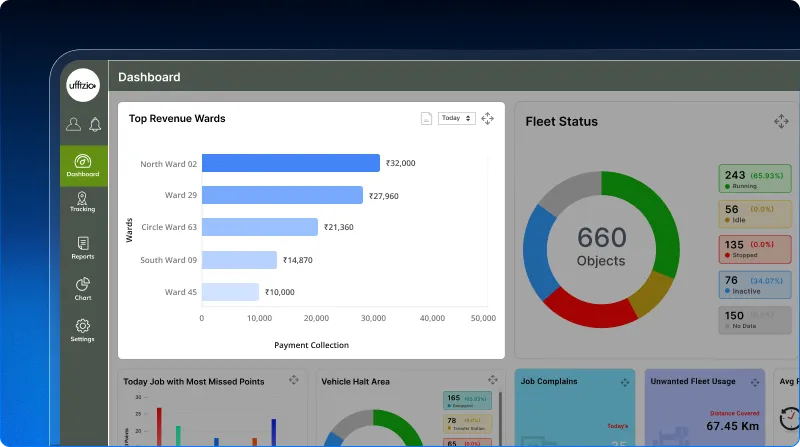 Users can also open the Textual View to review the payment records contributing to each ward’s ranking. The detailed view displays Town, Zone, Ward, and Paid Amount, and supports XLS and PDF exports.
Key benefits
- Identify the highest revenue-generating wards instantly.
- Compare revenue performance across operational areas.
- Analyze ward-wise collections over different time periods.
- Apply Town, Zone, and Ward filters for focused analysis.
- Access supporting payment records through the Textual View.
- Export ward revenue data for operational reviews and reporting.
Business impact
The Top Revenue Wards widget provides municipal teams with a quick way to evaluate payment collection performance across different wards. By highlighting the areas generating the highest revenue, SmartWaste helps managers compare operational performance, identify strong-performing regions, and make more informed revenue management decisions.
2.19 Prioritize high-risk zones with the Top Problem Areas widget
Operational challenges such as failed jobs, vehicle breakdowns, unresolved complaints, overflow bins, and unallocated collection addresses often remain scattered across multiple modules. Identifying the areas that require immediate attention can become time-consuming and delay corrective action.
The new top problem areas widget brings these operational insights together into a single dashboard view, helping managers quickly identify the zones or wards that require the highest priority.
What’s added
The Top Problem Areas widget automatically ranks operational areas based on an Issue Score calculated from multiple service and operational factors.
The widget includes:
- Top 5 Zones or Wards ranked by operational Issue Score.
- Switch between Zone and Ward views using a hierarchy selector.
- Automatic Issue Score calculation based on operational events.
- Integration with existing Town, Zone, and Ward dashboard filters.
- Rights-based visibility to ensure only authorized users can access the widget.
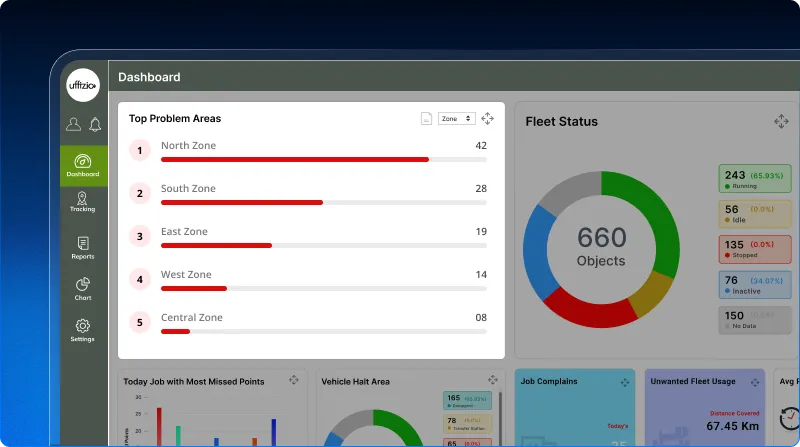 The Issue Score considers multiple operational factors, including:
- Failed, Forced Close, and Inspection Failed jobs.
- Unauthorized movement and vehicle deviation events.
- Vehicle repair, accident, breakdown, and not deployed status.
- Overflow bins and unallocated collection addresses.
- Open and In Progress complaints.
Users can also open the Textual View to review each area’s Issue Score along with the operational factors contributing to its ranking. The detailed view supports XLS and PDF exports.
Key benefits
- Identify operational hotspots from a single dashboard.
- Prioritize areas that require immediate attention.
- Compare problem areas across Zones and Wards.
- Consolidate issues from multiple operational modules into one view.
- Understand the factors contributing to each area’s ranking.
- Export issue summaries for operational reviews and planning.
Business impact
The Top Problem Areas widget provides a centralized view of operational performance by combining issues from jobs, vehicles, collection addresses, and complaints into a single ranking. This enables managers to focus resources where they are needed most, respond to operational challenges faster, and improve service delivery across municipalities.
2.20 Improve operational planning with the Collection Pattern Analysis chart
Collection performance often varies across different days of the week due to factors such as workforce availability, route planning, or operational workload. While reports provide current collection statistics, they do not reveal recurring performance patterns that can help managers plan ahead.
The new Collection Pattern Analysis chart helps identify these trends by analyzing collection efficiency across weekdays, making it easier to uncover recurring operational challenges and optimize planning.
What’s updated
The Collection Pattern Analysis chart has been added under the Operational Performance section of the Charts module.
The chart provides:
- Weekday-wise collection efficiency analysis.
- Interactive vertical column chart for easy comparison.
- Summary table displaying Scheduled, Collected, and Missed collection addresses.
- Collection Efficiency (%) calculated for each day of the week.
- Flexible filters including Company, Branch, Town, Zone, Ward, Job, and Date Range.
- Time period options such as This Week, Last Week, Last 7 Days, This Month, Last Month, and Custom Range (up to 31 days).
- Existing chart export functionality for sharing and reporting.
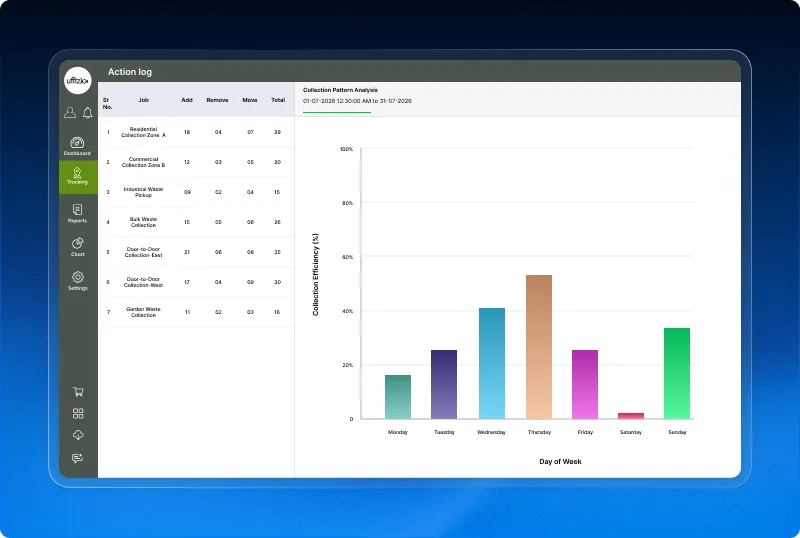 The chart updates dynamically based on the selected filters, allowing managers to analyze collection performance for different operational periods.
Key benefits
- Identify recurring low-performing weekdays.
- Compare collection efficiency across the entire week.
- Support better workforce and route planning decisions.
- Analyze historical collection performance using flexible filters.
- Export chart data for operational reviews and reporting.
- Make data-driven decisions to improve collection efficiency.
Business impact
The Collection Pattern Analysis chart transforms operational data into meaningful weekly insights. By highlighting recurring collection trends across weekdays, SmartWaste helps municipalities identify performance gaps, optimize resource allocation, and improve collection efficiency through more informed operational planning.
2.21 Monitor job modifications with the Action Log chart
Frequent changes to collection routes and addresses can indicate planning challenges, operational inefficiencies, or evolving service requirements. While the Action Log Report captures every Add, Remove, and Move activity, analyzing these changes across multiple jobs can be time-consuming.
The new Action Log chart transforms operational changes into an easy-to-understand visual format, helping managers identify jobs that require frequent modifications and optimize collection planning.
What’s updated
The Action Log chart has been added under the Operational Performance section of the Charts module to provide a visual comparison of operational changes across jobs.
The chart includes:
- Job-wise comparison of Add, Remove, and Move actions.
- Grouped vertical column chart for easy visual analysis.
- Summary table displaying Add Count, Remove Count, Move Count, and Total Action Count.
- Flexible filters for Company, Branch, Town, Zone, Ward, Job, and Time Period.
- Support for selecting up to eight jobs for comparison.
- Existing chart export functionality for reporting and analysis.
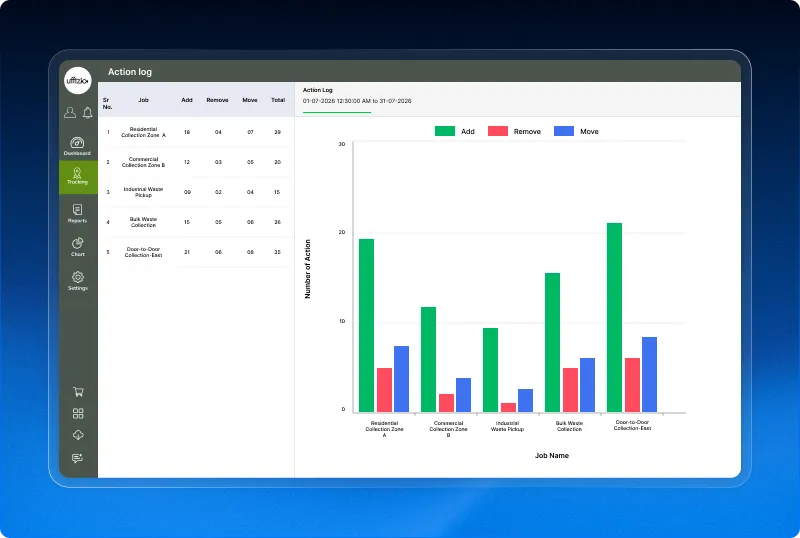 The chart dynamically updates based on the selected filters, enabling managers to monitor operational changes over different time periods.
Key benefits
- Compare operational changes across multiple jobs.
- Identify routes that require frequent modifications.
- Detect recurring planning and operational challenges.
- Analyze Add, Remove, and Move activities from a single view.
- Export chart data for operational reviews and reporting.
- Support data-driven route optimization and planning decisions.
Business impact
The Action Log chart converts operational audit data into meaningful visual insights, allowing managers to quickly identify jobs with frequent route changes and collection address modifications. This helps improve route planning, reduce unnecessary operational adjustments, and support more efficient waste collection operations.
2.22 Identify recurring complaint trends with the Complaint Analytics chart
Understanding when complaints occur is just as important as knowing how many are received. While reports and dashboard widgets provide the current complaint status, they don’t reveal recurring complaint patterns across different days of the week, making it difficult to identify operational trends and recurring service issues.
The new Complaint Analytics chart transforms complaint data into meaningful visual insights, helping managers identify high-complaint days and make proactive operational improvements.
What’s added
The Complaint Analytics chart has been introduced under the Complaint category in the Charts module to provide a visual analysis of complaint trends across weekdays.
The chart includes:
- Weekday-wise complaint trend analysis.
- Interactive vertical column chart showing total complaints.
- Summary table displaying Total, Open, In Progress, and Closed complaints for each weekday.
- Filters for Company, Branch, Town, Zone, Ward, Time Period, and Complaint Category.
- Time period options including This Week, Last Week, and Last 7 Days.
- Existing chart export functionality for reporting and analysis.
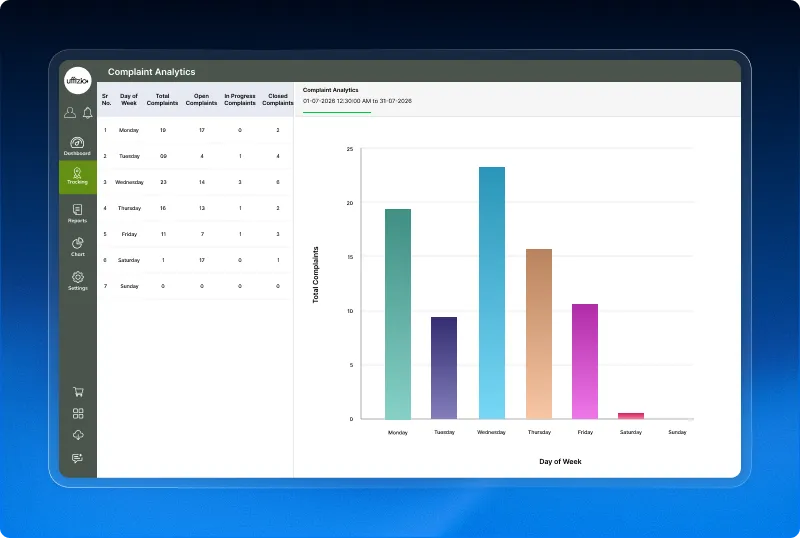 The chart dynamically updates based on the selected filters, allowing managers to compare complaint volumes across different weekdays and operational periods.
Key benefits
- Identify recurring high-complaint days.
- Compare complaint trends across the week.
- Understand complaint distribution by operational period.
- Filter analysis by complaint categories and locations.
- Export visual insights for operational reviews.
- Support proactive planning to reduce recurring service issues.
Business impact
The Complaint Analytics chart helps municipalities move beyond static complaint reporting by revealing recurring complaint patterns across weekdays. With clear visual insights into complaint trends, managers can better allocate resources, investigate recurring issues, and improve overall service quality through more informed operational planning.
2.23 Analyze job performance with the Job Completion Trend chart
Monitoring completed jobs for a single day provides only a snapshot of operations. To identify recurring performance trends, managers need a historical view that highlights how job execution changes over time.
The new Job Completion Trend chart helps visualize completed job trends across a selected period, enabling managers to evaluate operational consistency and identify opportunities for performance improvement.
What’s added
The Job Completion Trend chart has been added under the Job category in the Charts module to provide a visual analysis of job execution over time.
The chart includes:
- Date-wise visualization of completed jobs.
- Interactive vertical column chart for trend analysis.
- Summary table displaying Completed Jobs, Failed Jobs, and Total Jobs for each date.
- Flexible filters for Company, Branch, Town, Zone, Ward, Job, and Date Range.
- Support for analyzing up to 31 days of operational data.
- Existing chart export functionality for reporting and analysis.
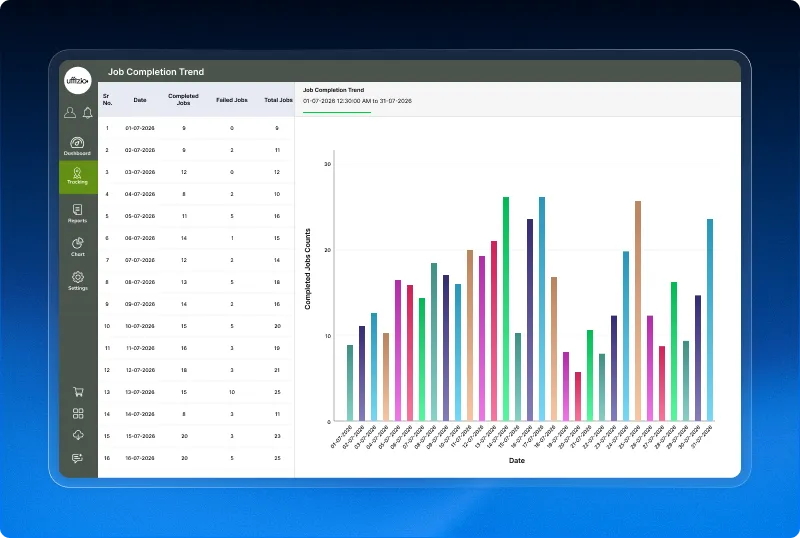 The chart updates dynamically based on the selected filters, allowing managers to compare job completion performance across different operational periods.
Key benefits
- Monitor job completion trends over time.
- Compare completed and failed jobs across different dates.
- Identify recurring periods of high or low operational performance.
- Analyze execution consistency using flexible filters.
- Export chart data for operational reviews and reporting.
- Support better planning with historical execution insights.
Business impact
The Job Completion Trend chart provides a clear visual representation of operational performance over time, helping municipalities move beyond day-to-day monitoring. By identifying historical execution trends, SmartWaste enables managers to make informed planning decisions, improve operational consistency, and optimize job execution across their waste collection operations.
3. Gridzee Updates
3.1 Create optimized indoor routes with AI auto-suggestions
Creating indoor navigation routes manually can be time-consuming, especially for complex floor layouts. Determining the most efficient path often requires multiple adjustments, increasing configuration effort and the possibility of inconsistent route planning.
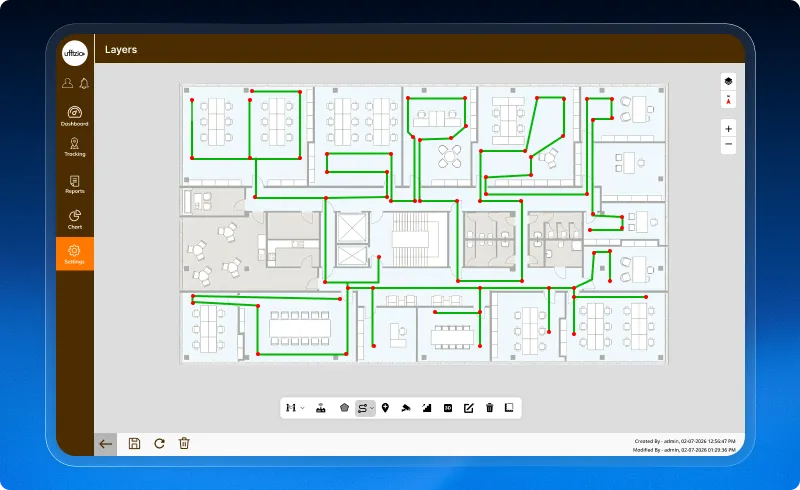
Gridzee now introduces AI-powered route suggestions that automatically recommend optimized routes during route creation, helping administrators configure indoor maps faster and with greater accuracy.
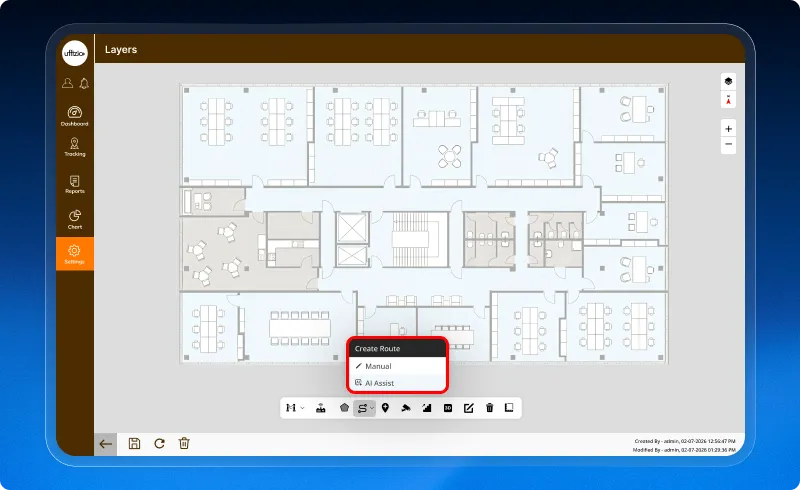 What’s added
AI auto-suggestion has been integrated into the route creation process within the layers configuration module.
The enhancement includes:
- AI-powered route suggestions during route creation.
- Automatic analysis of the indoor floor layout to recommend an optimal route.
- AI-generated route preview before saving.
- Option to review, modify, or accept the suggested route.
- Seamless integration with the existing route creation workflow.
 Key benefits
- Reduce manual effort in route planning.
- Generate optimized indoor routes automatically.
- Improve route accuracy and consistency.
- Speed up indoor map configuration.
- Allow users to customize AI-generated routes before saving.
- Enhance overall planning efficiency.
Business impact
By combining AI with indoor route planning, Gridzee simplifies one of the most time-intensive configuration tasks. Administrators can create optimized navigation routes more quickly, reduce manual errors, and deliver more accurate indoor tracking experiences while maintaining complete control over the final route configuration.
3.2 Add points of interest more efficiently from layers
Configuring indoor maps often requires switching between multiple screens to complete related tasks. Managing Points of Interest (POIs) separately from layer configuration increases setup time and interrupts the overall mapping workflow.
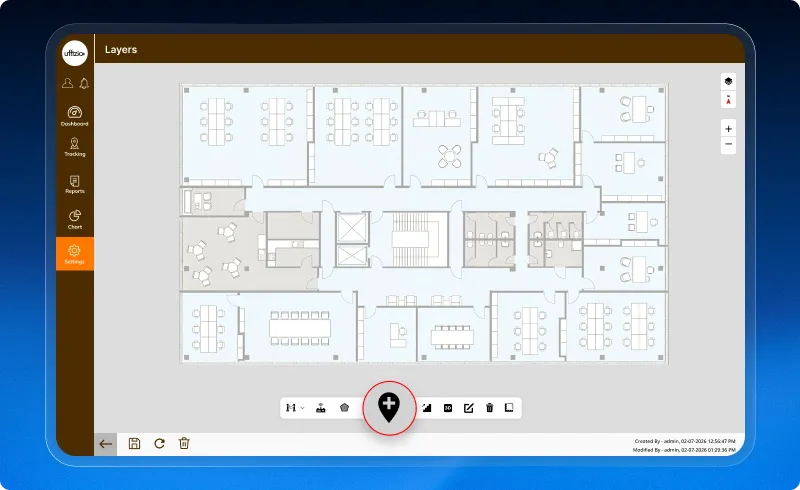
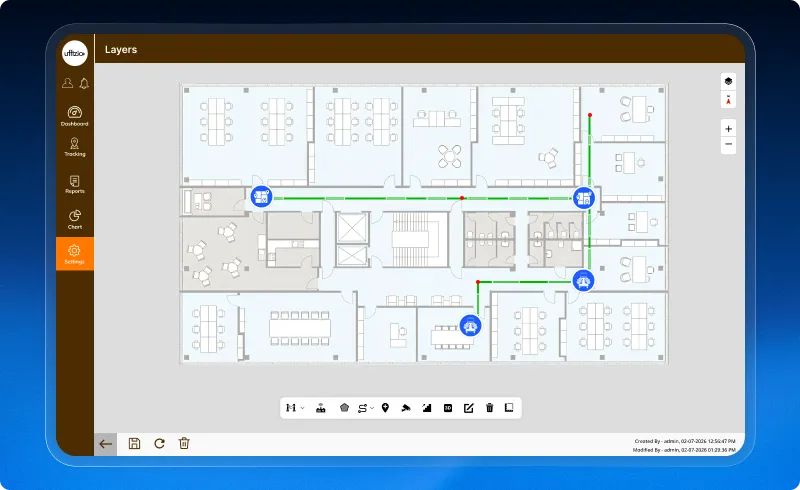
Gridzee now streamlines this process by enabling POIs to be added directly from the Layers screen, creating a more unified and efficient indoor map configuration experience.
 What’s added
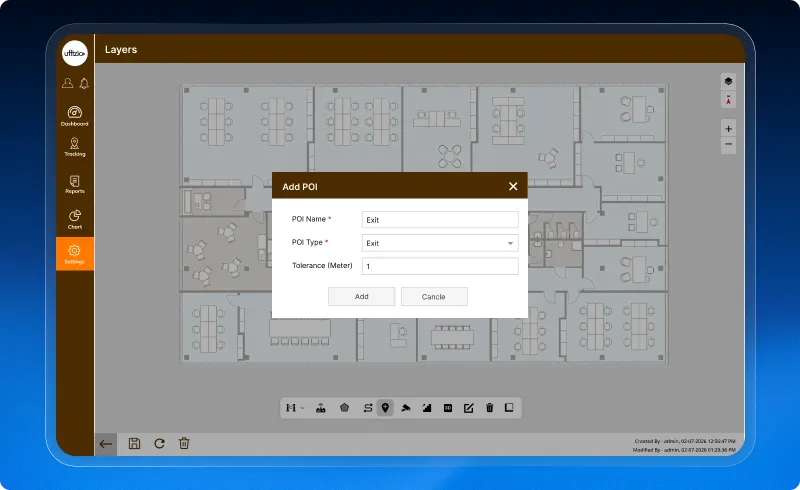
POI management has been integrated into the Layers configuration screen, allowing administrators to add Points of Interest without navigating to a separate module.
 The enhancement includes:
- POI creation directly from the Layers screen.
- Unified workflow for configuring layers and Points of Interest.
- Faster indoor map setup with fewer navigation steps.
- Seamless integration with the existing Layers configuration process.
- Support for the updated POI management workflow.
 Key benefits
- Reduce the time required to configure indoor maps.
- Eliminate unnecessary navigation between different screens.
- Simplify the POI creation process.
- Improve configuration efficiency with a centralized workflow.
- Deliver a smoother and more intuitive map management experience.
Business impact
By integrating POI management into the Layers screen, Gridzee simplifies indoor map configuration and reduces administrative effort. The streamlined workflow enables faster deployment of indoor tracking environments while improving the overall usability of the platform for administrators.
3.3 Enhance indoor visibility with smarter live tracking
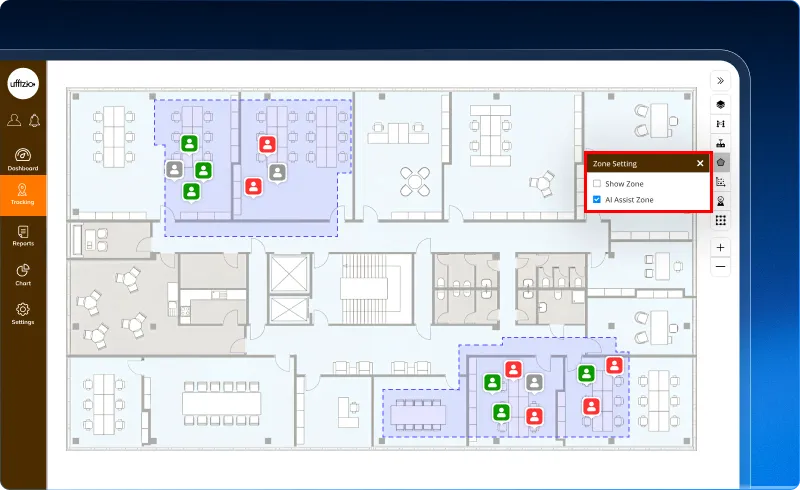
Gridzee’s Live Tracking module has been enhanced with intelligent monitoring capabilities, making it easier to locate, track, and manage people and assets in real time. The update combines AI-powered insights, improved visualization, and advanced filtering to deliver a more efficient indoor tracking experience.
What’s updated
The enhanced Live Tracking screen now includes:
- Smart search and advanced filters to quickly locate people and assets.
- Dynamic object clustering for a cleaner and more organized map view.
- Visual alerts and movement trails for better activity monitoring.
- AI-powered Zone of Interest detection to identify recurring gathering areas.
- One-click replay to review historical movements with playback controls.
- Focus Mode and Object Group filtering for more targeted monitoring.
 Key benefits
- Find objects faster with intelligent search.
- Improve map clarity with dynamic clustering.
- Detect critical events through visual alerts.
- Analyze movement history more effectively.
- Gain AI-driven insights into indoor activity patterns.
- Monitor selected individuals or groups with greater precision.
Business impact
These enhancements make Gridzee’s Live Tracking module more intelligent and user-friendly, helping organizations improve operational visibility, respond to events faster, and manage indoor environments with greater efficiency.
3.4 Navigate Gridzee in your preferred language
As organizations deploy indoor tracking solutions across different regions, providing a localized user experience becomes increasingly important. Language barriers can affect usability and slow down user adoption, especially for global teams.
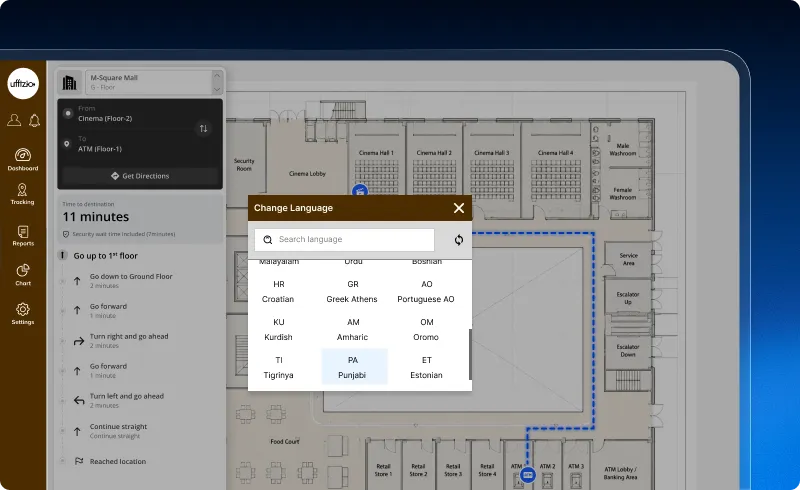
Gridzee now introduces multi-language support for the navigation interface, making it easier for users to access and navigate the application in their preferred language.
What’s updated
The navigation interface has been enhanced to support multiple languages.
The enhancement includes:
- Multi-language support for the navigation menu.
- Localized navigation labels for a more user-friendly experience.
- Consistent navigation across supported languages.
- Foundation for expanding language support across the application.
 Key benefits
- Improve accessibility for multilingual users.
- Deliver a more localized user experience.
- Reduce language barriers during navigation.
- Enhance usability for global deployments.
- Support faster user adoption across different regions.
Business impact
With multilingual navigation support, Gridzee becomes more accessible to users across diverse geographies. The enhancement improves usability, supports international deployments, and creates a more inclusive experience for organizations operating in multilingual environments.
3.5 Experience smarter indoor navigation with enhanced POIs
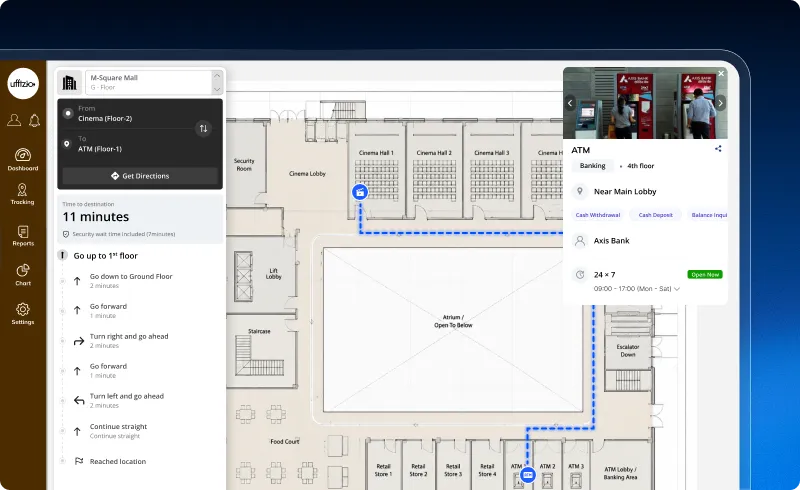
Finding a destination is only part of the indoor navigation experience. Visitors often need additional context, such as operating hours, images, department details, or contact information, before deciding where to go. To address this, Gridzee now enhances Point of Interest (POI) management by allowing administrators to create richer POI profiles that are displayed directly during wayfinding.
What’s new
The POI module has been enhanced with a new Additional Info section, enabling administrators to enrich each Point of Interest with detailed information.
The enhancement includes:
- A redesigned POI configuration screen with separate General Info and Additional Info tabs.
- Support for uploading up to three images for each POI.
- Operating and visiting hours configuration with real-time Open Now or Closed status.
- Description field for adding detailed POI information.
- Speciality tags, contact names, and room or counter details for healthcare, retail, and enterprise environments.
- Interactive POI information cards in the wayfinding screen with images, operating hours, descriptions, and a Get Directions button.
- Responsive information panels optimized for desktop, tablet, and mobile devices.
 Key benefits
- Provide visitors with richer information before navigation.
- Improve wayfinding with images and detailed POI profiles.
- Display operating hours and availability in real time.
- Support healthcare, retail, corporate, and campus deployments with customized POI information.
- Deliver a more engaging and informative indoor navigation experience.
Business impact
The enhanced POI module transforms indoor maps into interactive information hubs by combining navigation with rich contextual information. Whether guiding visitors to hospital departments, retail stores, meeting rooms, or other facilities, Gridzee helps organizations improve visitor experiences, reduce confusion, and make indoor navigation more informative and intuitive.
Conclusion
Innovation is an ongoing journey, and every release reflects our commitment to building solutions that evolve alongside our customers’ operational requirements. By continuously enhancing usability, intelligence, and performance across our platforms, we strive to help businesses make faster decisions, improve operational efficiency, and deliver exceptional service experiences.
Thank you for being part of our journey. We look forward to bringing you even more powerful enhancements in the months ahead.