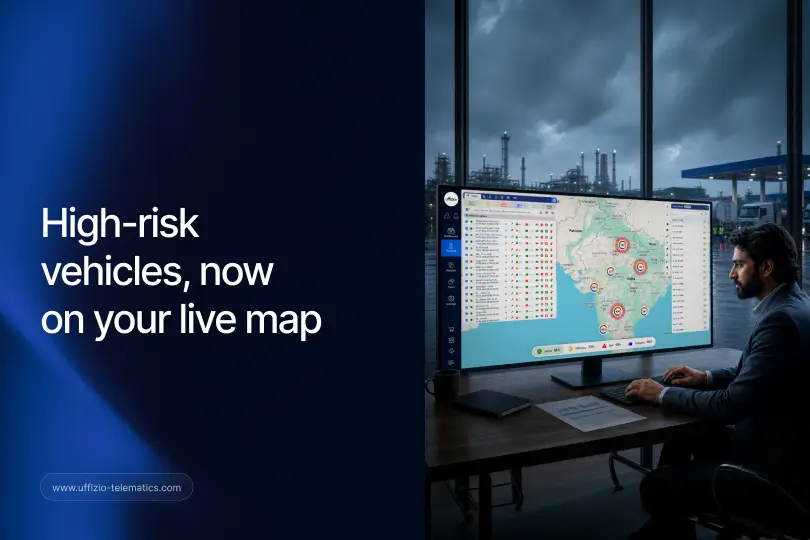
You’re managing five hundred vehicles. Which ones are a risk right now? Before, you’d have to open each one to check. Now, the map simply tells you.
Trakzee’s new Risk Layer brings risk intelligence straight onto the live tracking map, so the vehicles that need your attention are visible the moment you look, not several clicks later.
Risk Scores Were Always There. You Just Couldn’t See Them Fast Enough
Trakzee has offered vehicle-level risk scores for a while now, built from real driving behaviour and safety-related events. The information itself has always been solid. The problem was access.
To see a vehicle’s risk score, you had to open its individual details. That’s a reasonable ask when you’re managing ten vehicles. It’s not realistic when you’re managing hundreds, spread across multiple cities, all moving at once on a live map.
In practice, this meant risk scores often went unused during day-to-day monitoring. Managers would check them during a scheduled review, or after something had already gone wrong, rather than catching a pattern while there was still time to act on it.
That’s the gap the Risk Layer closes.
What the New Risk Layer Actually Shows You
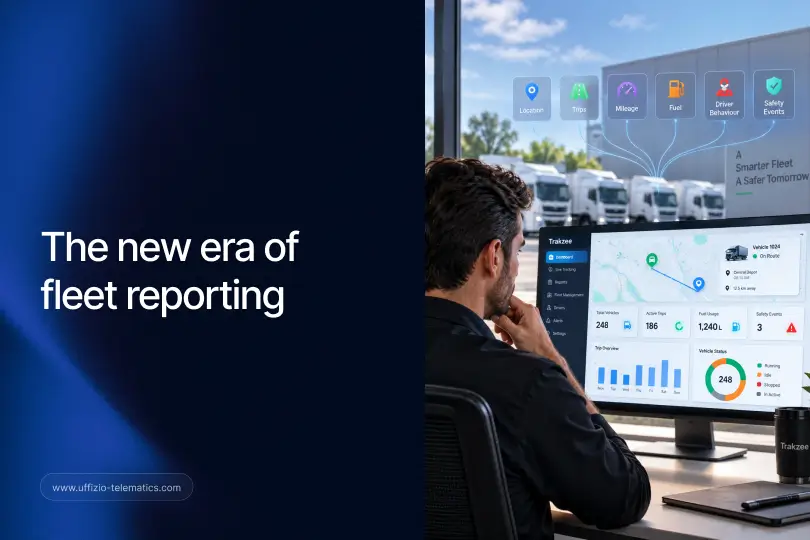
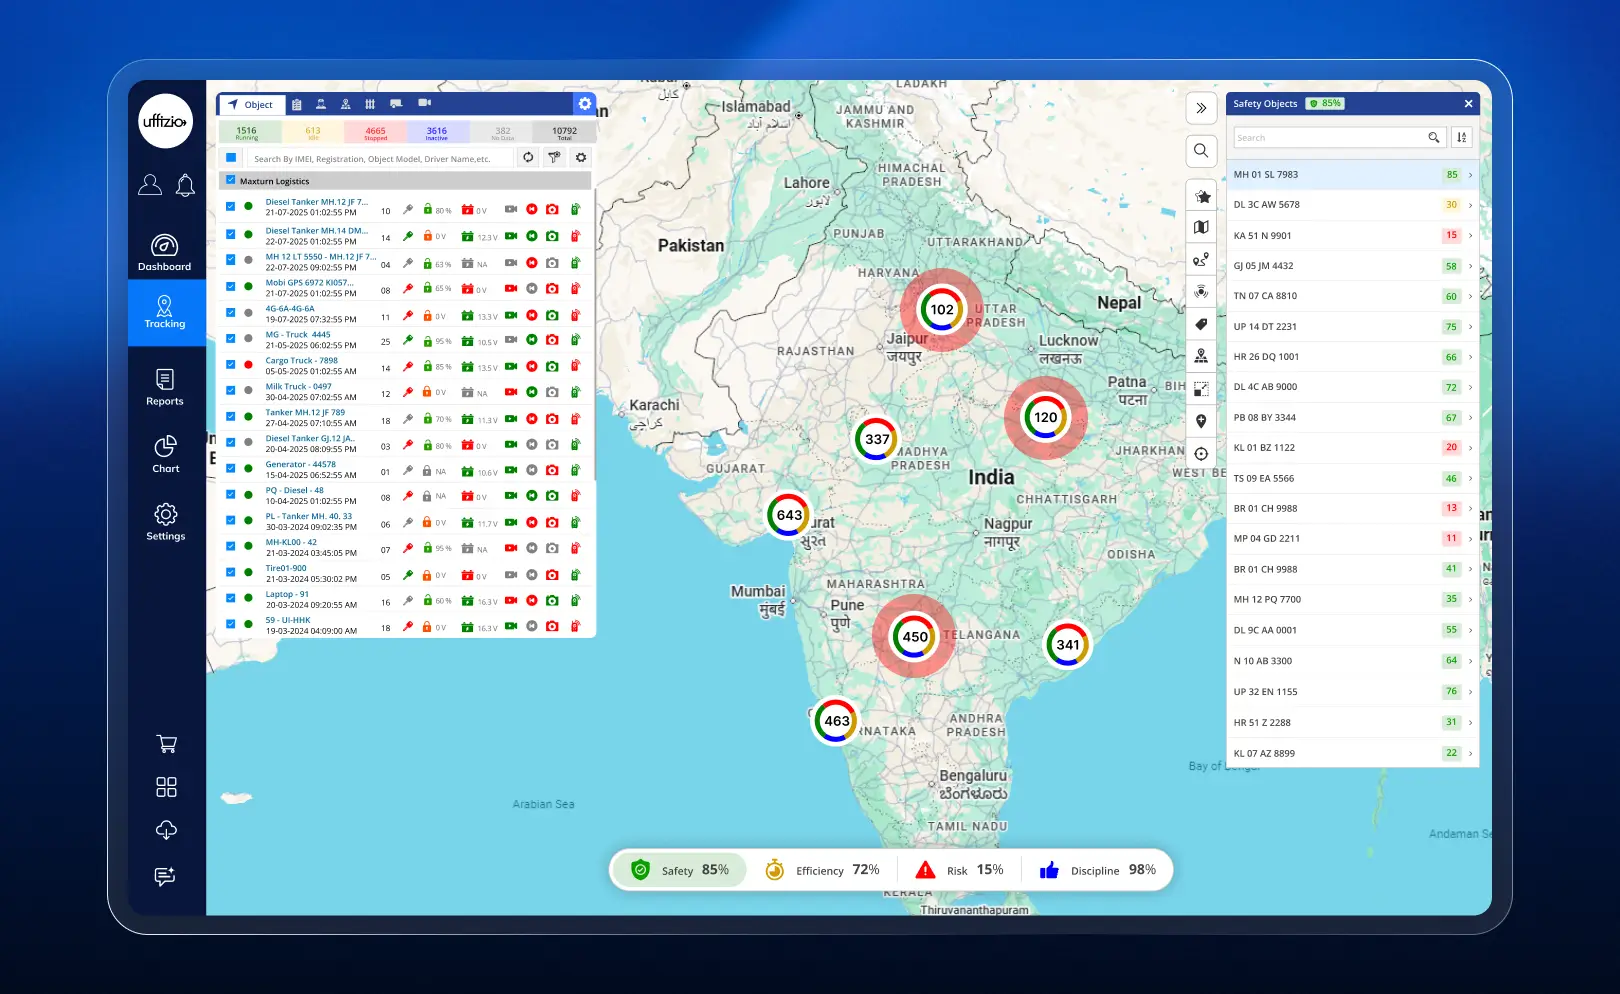
Turn on the Risk Layer, and your live map changes in a genuinely useful way. Clusters of vehicles that contain high-risk vehicles are visually highlighted, so you notice them without needing to hunt.
As you zoom into the map, individual high-risk vehicles remain clearly distinguishable, even as clusters break apart into single vehicle markers. You’re never left wondering which vehicle in a group was the one worth checking.
This means a fleet manager glancing at their live map first thing in the morning can immediately spot which areas or vehicles deserve a closer look, without running a single report first.
One Click to Risk Insights
Spotting a high-risk vehicle is only useful if you can quickly understand why it’s flagged. Trakzee makes that part just as fast.
Click on any highlighted vehicle, and you’ll see its existing Performance Score alongside detailed Risk Insights. This tells you exactly what’s driving the flag: repeated harsh braking, a pattern of overspeeding in a specific zone, unusual routes, or another behavioural signal.
There’s no separate report to pull or export to wait for. The explanation is right there, the moment you click.

Turn It On. Or Off. Your Call.
The Risk Layer is enabled by default, reflecting how useful most teams find it from day one. But not every team monitors risk the same way, and Trakzee gives you full control here.
You can switch the Risk Layer on or off anytime through map settings, based on your team’s preferences or the specific task at hand. Some managers keep it on permanently as a background safety net. Others turn it on specifically during busy periods, or when reviewing a particular region.
Either way, the choice is entirely yours, and switching it doesn’t affect any other part of your live tracking view.
A Real Morning, Before and After
Consider Arjun, who manages a regional delivery fleet of 420 vehicles. Before the Risk Layer, his morning routine involved opening a risk report generated overnight, scanning a list of vehicle IDs and scores, then manually cross-referencing which ones were currently active and where they were operating.
By the time he’d matched the report to the live map, twenty minutes had passed, and in a fast-moving fleet, some of those vehicles had already finished their most risky stretch of driving for the day.
Now, Arjun opens his live map each morning and sees the picture immediately. Two clusters near a construction zone are highlighted. He zooms in, sees three vehicles flagged individually within that area, and clicks one to see its Risk Insights: a pattern of harsh braking near the same intersection over the past week. He calls the driver directly, within two minutes of logging in.
The information didn’t change. The speed of acting on it did.
Why This Matters Beyond Safety
It’s easy to file this under “safety feature” and move on. But the impact runs wider than that.
Vehicles flagged as high risk are more likely to be involved in accidents, receive traffic violations, or suffer excess wear and maintenance costs from aggressive driving. Catching these patterns earlier means fewer insurance claims, fewer unplanned repairs, and fewer conversations with customers about a damaged shipment or a missed delivery window.
For fleets operating in regulated industries, or for system integrators supporting customers with strict safety and compliance requirements, being able to demonstrate proactive risk monitoring, not just reactive incident review, is a meaningful differentiator. The Risk Layer turns “we have risk scores” into “we actively watch for risk, all day, on the same map our team already uses.”
Curious how this fits your fleet’s specific risk profile? [Book a session with your Uffizio account manager] and we’ll walk through your current risk data together, and help you decide the right default settings for your team.
Where to Find It
The Risk Layer is available now on both the Trakzee web platform and the mobile application, so the same visibility follows your team whether they’re at a desk or checking the map from the field. No additional hardware or configuration is required to start using it.
Part of a Bigger Shift Toward Proactive Monitoring
The Risk Layer works well on its own, but it becomes even more powerful alongside two other recent Trakzee updates: the AI Priority Feed and the Fleet Performance Score.
The AI Priority Feed scans your fleet’s alerts every hour and surfaces the three that need attention first. The Fleet Performance Score gives you a broader view across safety, efficiency, risk, and discipline, updated continuously. The Risk Layer sits between the two, giving you a live, visual answer to a very specific question: which vehicles, right now, on this map, need a closer look?
Together, these three updates move Trakzee further away from a tool you check periodically, and closer to a system that actively watches your fleet alongside you. Instead of waiting for a scheduled report or an incident to trigger a review, patterns surface as they’re happening, on the same screen your team already has open.
For fleets managing safety-sensitive operations, whether that’s passenger transport, hazardous materials, or simply a large delivery network, this shift from reactive to proactive monitoring is where the real value shows up over time, not just in a single incident avoided, but in a steady reduction of risk across the whole fleet.
Frequently Asked Questions
Does turning on the Risk Layer slow down my live map? No. The Risk Layer is built to run alongside your existing live tracking view without adding noticeable load time, even across large fleets.
How is a vehicle’s risk score calculated? Risk scores are built from behavioural and safety-related events, the same underlying data used in Trakzee’s existing Performance Score. The Risk Layer simply makes that score visible on the map, without changing how it’s calculated.
Can I set my own threshold for what counts as high risk? The Risk Layer uses Trakzee’s existing risk scoring model out of the box. If your team wants to discuss threshold settings specific to your operation, your Uffizio contact can walk you through the available options.
Will this work across multiple branches or regions on one map? Yes. The Risk Layer highlights high-risk vehicles and clusters across your entire visible fleet, regardless of how many branches or regions you’re viewing at once.
Is the Risk Layer included with my current Trakzee plan? The Risk Layer is part of Trakzee’s live tracking module. If you’re unsure whether it’s active on your account, your Uffizio account manager can confirm and help you enable it.
Key Takeaway
The fastest way to reduce risk is to make it impossible to miss. Trakzee’s new Risk Layer puts that principle directly on the map your team already checks every day, turning a once-buried score into an instantly visible signal.