Is your fleet actually doing well? It’s a simple question. But until now, answering it meant opening five different reports, comparing numbers by hand, and hoping you didn’t miss something important along the way.
Now, it takes one glance.
Trakzee’s new Fleet Performance Score brings together everything that matters about how your fleet is running, and puts it in one place. No spreadsheets. No juggling tabs. Just a clear picture, updated in real time.
Why One Number Beats Five Reports
Fleet data has always been rich. Maybe too rich. Speed reports tell you about driving habits. Fuel reports tell you about spending. Compliance reports tell you about rule-following. Safety reports tell you about risk events. Each one useful. None of them, on their own, giving you the full story.
The result? Fleet managers end up doing the analysis themselves, in their heads, after reading through report after report. That takes time. It also leaves room for error, especially when you’re managing a large fleet and trying to compare vehicles or drivers quickly.
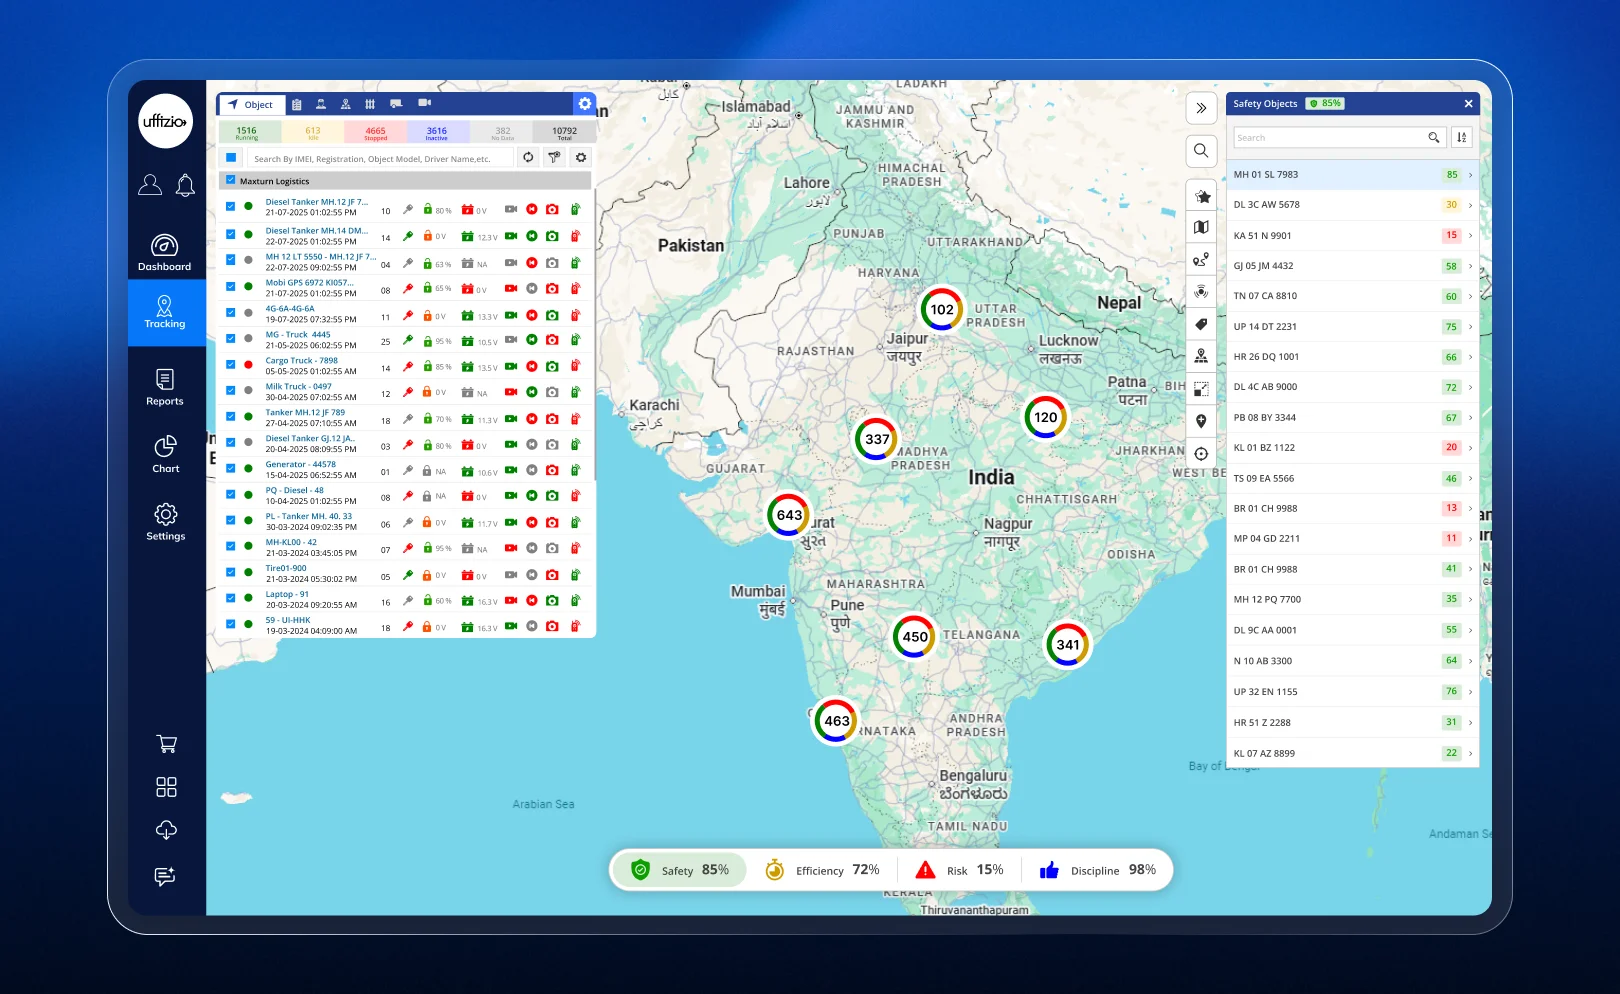
Trakzee now solves this by bringing all of that information together into a single performance score bar, sitting right inside Live Tracking. One glance tells you where your fleet stands. No extra clicks required to get the headline answer.
Meet the Four Scores Behind the Number
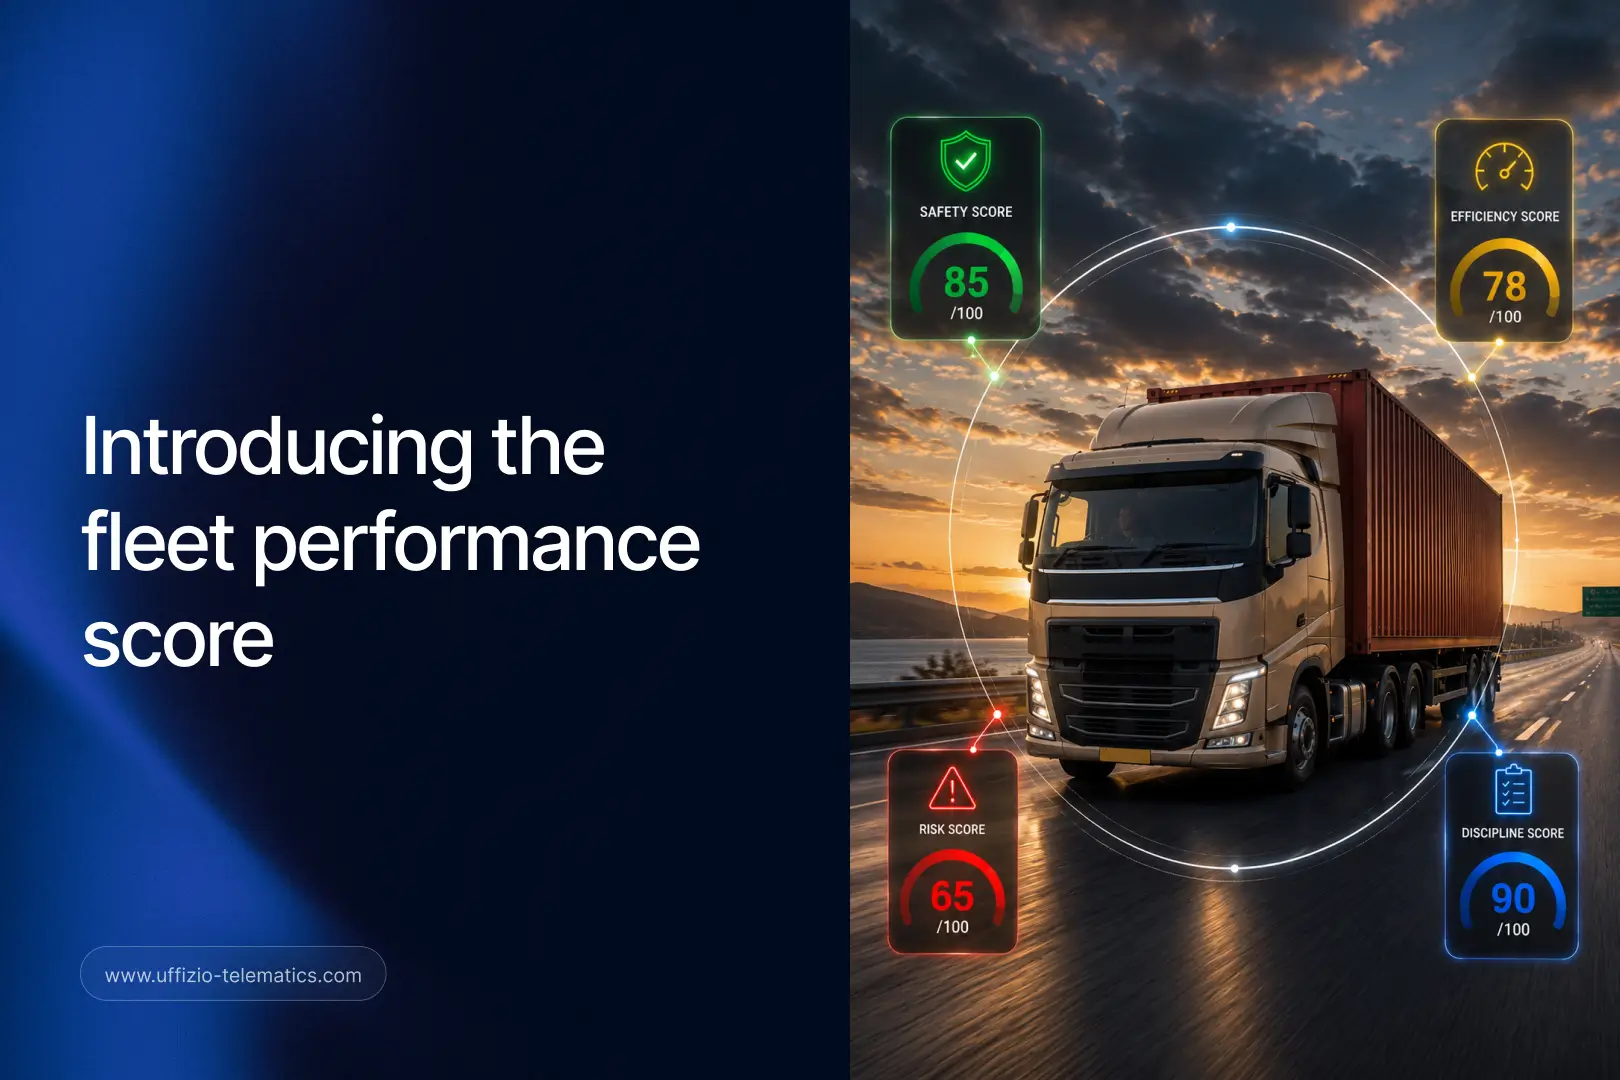
The Fleet Performance Score isn’t one vague rating. It’s built from four separate scores, each measuring something specific, so you always know exactly what’s driving the number.
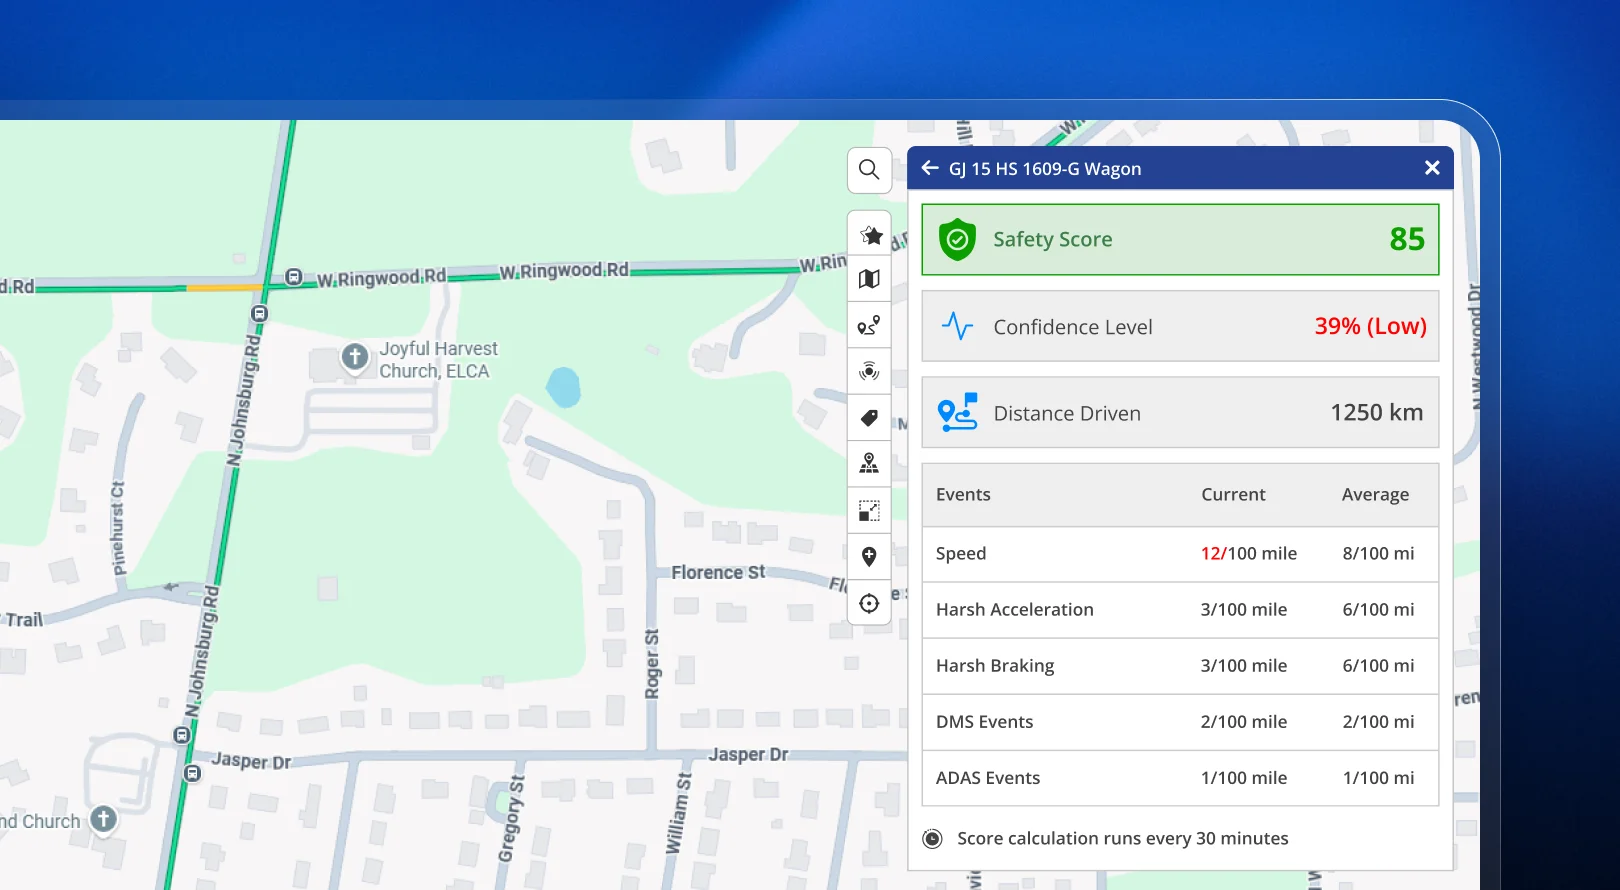
Safety Score looks at how your drivers actually drive. It factors in events like overspeeding, harsh braking, harsh acceleration, and any ADAS or DMS events picked up by onboard safety systems. If your drivers are behaving safely on the road, this score reflects it directly.
Efficiency Score checks how well a vehicle is actually being used. This looks at things like engine idle behaviour and overall operational performance, helping you spot vehicles that are burning fuel and time without much to show for it.
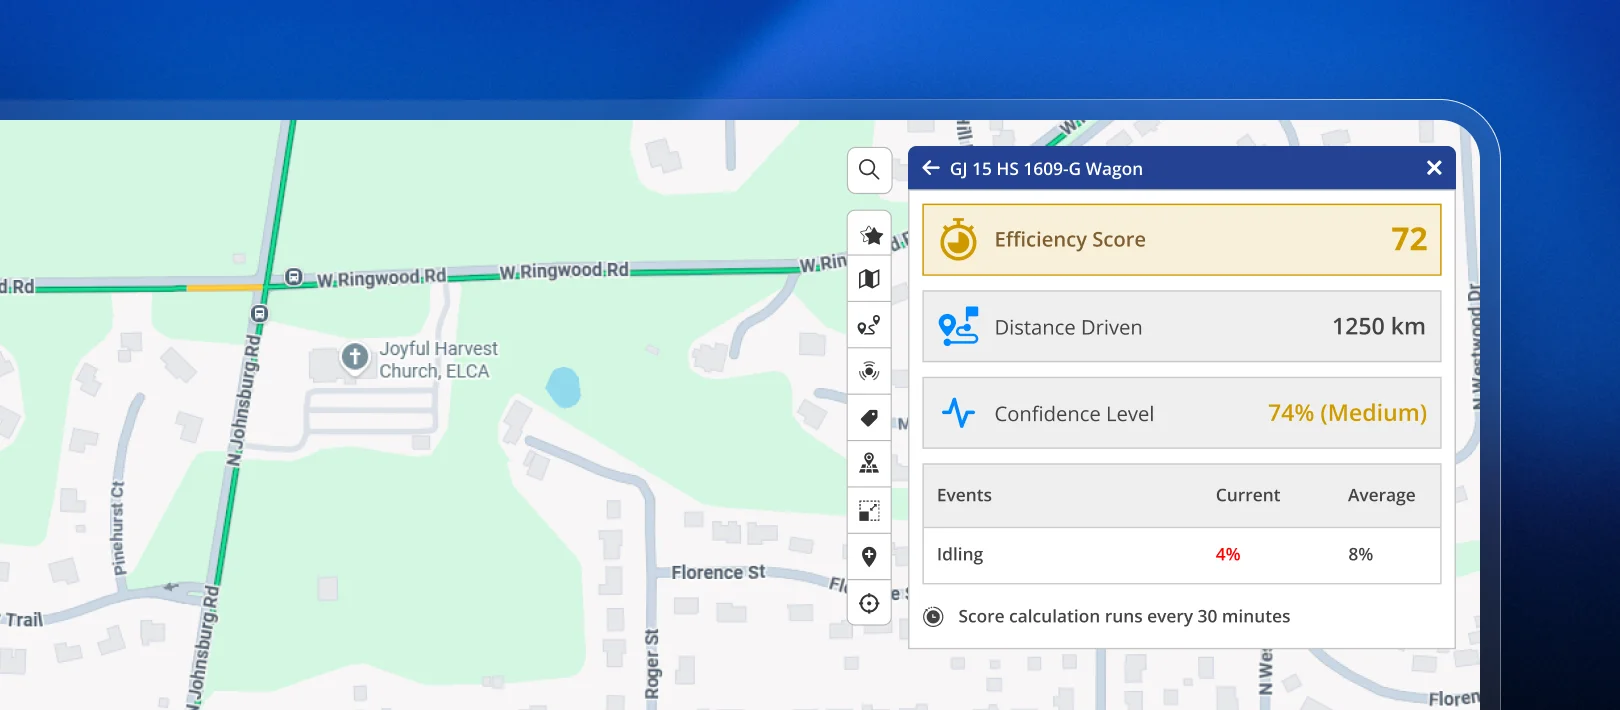
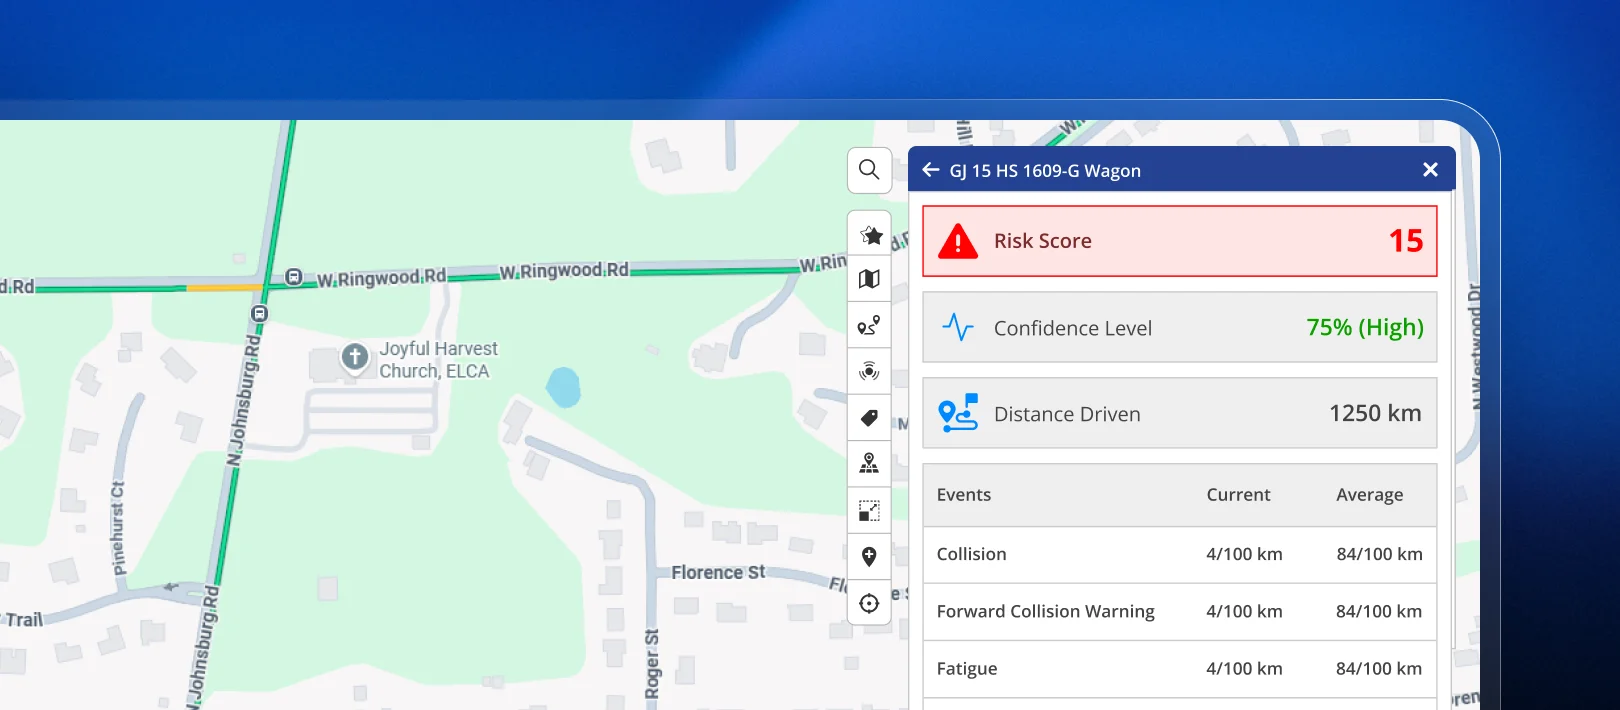
Risk Score highlights the likelihood of unsafe driving or vehicle misuse, based on real behavioural and safety-related events. Think of it as an early warning signal, flagging vehicles before a small pattern becomes a serious incident.
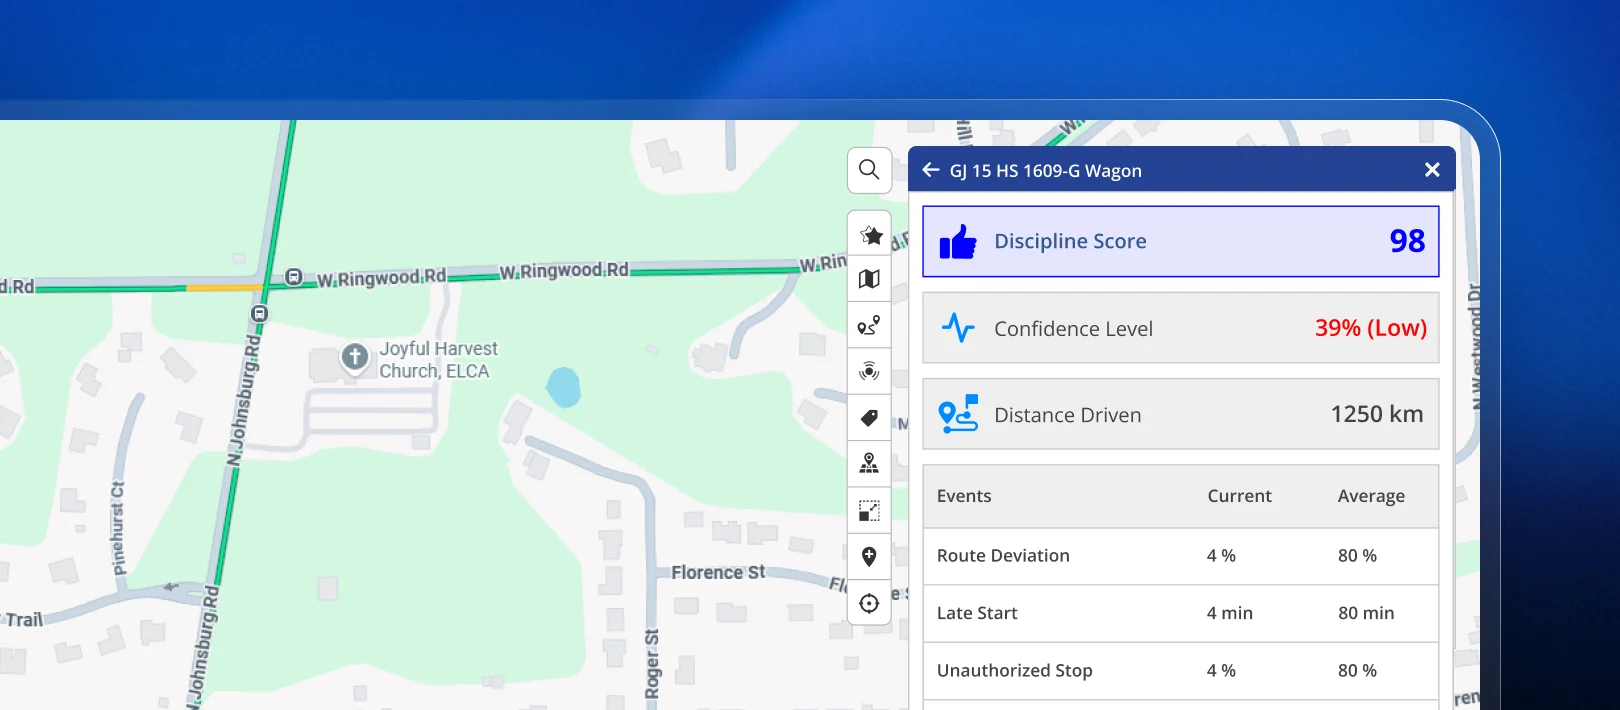
Discipline Score measures how well a vehicle sticks to the operational rules you’ve set. Route adherence, geofence usage, and scheduled operations all feed into this score, giving you a clear read on how consistently your rules are being followed on the ground.
Together, these four scores replace what used to take four separate investigations with one dashboard view.
How the Score Actually Works
Here’s the part that matters most for day-to-day use: every score is interactive, not just a static number sitting on a screen.
Start at the fleet level to get an overall sense of how things are going. Then drill down into any single vehicle to see exactly which events are pulling its score up or down. Want to know why a truck’s Safety Score dropped this week? Click through and see the specific harsh-braking events behind it.
Scores update automatically as new data comes in from your vehicles. That means you’re always looking at where things stand today, not a snapshot from last week that’s already out of date.
See your score right now. [Open Live Tracking in Trakzee] and look for the new performance score bar at the bottom of the screen.
A Day in the Life: Before and After
Consider Meera, who oversees a logistics fleet of 300 vehicles across three cities. Every Monday, she used to spend close to an hour pulling together a status update for her regional director: safety incidents from one report, fuel efficiency from another, compliance violations from a third.
By the time she’d compiled everything, the numbers were already a few days old, and she’d often missed a smaller pattern buried in one of the reports.
Now, Meera opens Trakzee on Monday morning and sees her fleet’s four scores immediately. She notices the Discipline Score for her western region has dropped slightly. One click shows her three vehicles have been skipping a scheduled checkpoint. She flags it to the regional supervisor before her 9 a.m. meeting, with real data already in hand.
What used to take an hour of manual comparison now takes less than five minutes, and the data is current, not several days old.
Why This Genuinely Changes How You Run a Fleet
It’s tempting to see this as a dashboard convenience. It’s actually a shift in how decisions get made.
When safety, efficiency, risk, and discipline all live in separate reports, problems tend to get noticed late, usually after they’ve already caused damage, whether that’s a late delivery, a safety incident, or a compliance issue. When all four live in one score, patterns show up early, while there’s still time to act on them.
This also changes how performance conversations happen with drivers and teams. Instead of a vague comment like “we’ve had some safety concerns,” a manager can point to a specific score, show exactly which events caused it to drop, and have a focused, fact-based conversation.
For system integrators and larger fleet operations, this is also a strong story to bring to customers who are evaluating renewal or expansion. It shows the platform doing more of the analytical heavy lifting, not just collecting more raw data.
Where You’ll Find It
The performance score bar is live now, inside Live Tracking, on both the web platform and the Trakzee mobile app. There’s no separate setup required on your end. If your fleet is already using Trakzee, the scores are already being calculated in the background.

How This Connects to the Rest of Trakzee
The Fleet Performance Score doesn’t work in isolation. It pairs naturally with Trakzee’s new AI Priority Feed, which scans your fleet’s alerts every hour and surfaces the three that need attention right now.
Think of the two together as a simple rhythm. The Performance Score gives you the weekly or monthly view: how is my fleet trending, and where should I focus my attention over time? The AI Priority Feed gives you the hourly view: what needs my attention in the next few minutes?
One tells you the direction you’re heading. The other tells you the next step to take. Used together, they replace a whole stack of manual reporting habits with two dashboard views that update themselves.
This is also part of a broader pattern across this year’s Trakzee updates. Feature by feature, the platform is taking on more of the analysis that used to sit entirely on a fleet manager’s shoulders, freeing up time for the decisions that actually need a human judgment call.
Frequently Asked Questions
Do I need to configure anything before the scores start working?
No. The four scores calculate automatically using your existing fleet data. There’s nothing to turn on separately.
Can I see historical scores, or only the current one?
The score bar reflects current performance, and you can drill into individual vehicles to see the specific events behind recent changes.
Does this replace my existing safety and compliance reports?
No. Your existing reports still work exactly as before. The Fleet Performance Score sits alongside them as a faster, at-a-glance summary.
Is this available for every vehicle type in my fleet?
Yes, the scoring applies across your fleet, so you can compare vehicles and drivers on the same, consistent scale.
Can I compare performance across different branches or regions?
Yes. Since scores are visible at both the fleet and vehicle level, comparing performance across locations takes only a few clicks.
Will this work for a mixed fleet, with different vehicle types?
Yes. The scoring model is built to apply consistently across vehicle types, so cars, trucks, and specialized vehicles can all be compared on the same scale.
Key Takeaway
The best fleet decisions begin with knowing exactly how your fleet is performing. Trakzee’s new Fleet Performance Score now gives you that answer in one glance, backed by four clear signals you can trust and act on immediately.