If you’ve worked with fleet data long enough, you’ve probably faced this.
Reports keep coming in—trip summaries, travel logs, speed charts—but instead of helping, they start to overwhelm.
You see numbers everywhere.
But the next step is still unclear.
The real problem isn’t data. It’s clarity. Most reports show what happened, but not what to do next. And that’s where fleet reporting is quietly evolving.
A Smarter Way to Read Fleet Data
Not all reports serve the same purpose. A trip report looks at efficiency. A travel history report shows movement. A speed report reflects driving behavior.
Yet, for years, they’ve been treated the same way—with static dashboards and generic summaries.
Now, things are shifting. Reports are becoming more context-aware. Instead of repeating the same insights everywhere, they adapt based on what each report is meant to solve.
What’s changing in simple terms:
- Insights are tailored to each report’s purpose
- Data is filtered to show only what matters
- Outputs are becoming more action-oriented
This shift makes reports easier to read—and far more useful.
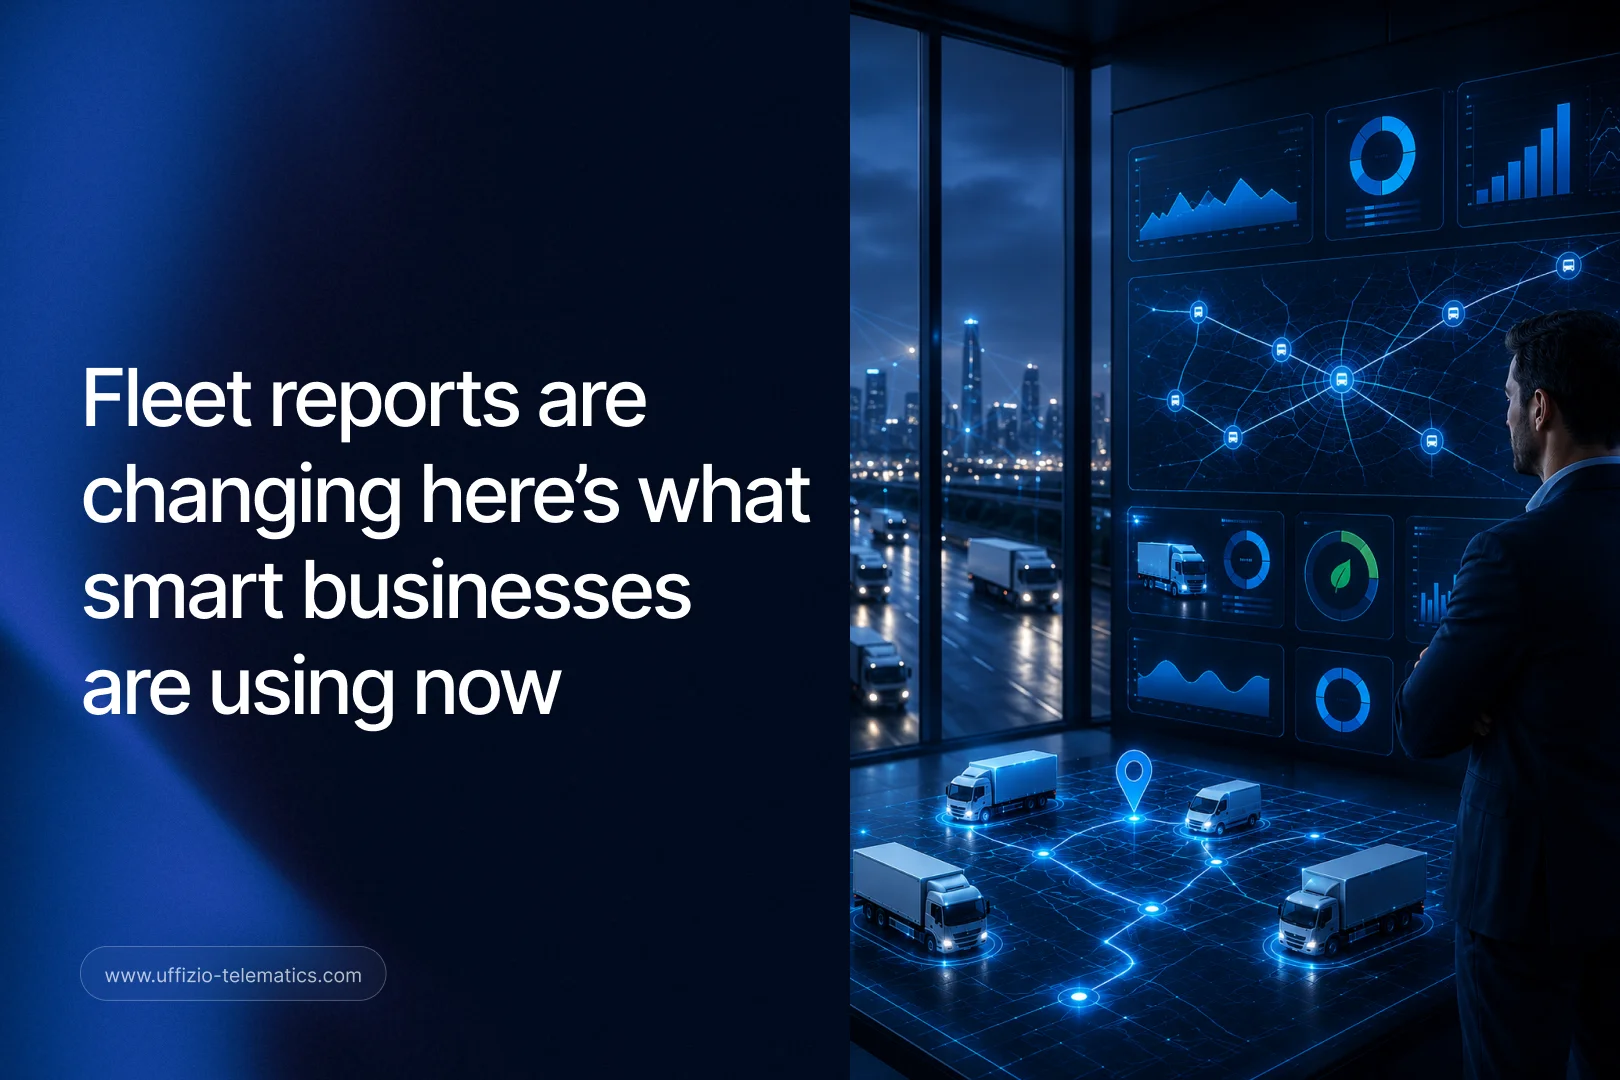
What Modern Fleet Reporting Looks Like
The biggest change is how reports communicate. They are no longer just data-heavy screens. They are becoming more like guided explanations.
Instead of spending time figuring things out, users can directly focus on improvement areas.
Key characteristics of modern reporting:
- Context-aware insights for every report
- Automated analysis without manual effort
- Clear identification of inefficiencies
- Built-in suggestions for improvement
- Reduced noise and better data clarity
It’s less about analyzing and more about understanding instantly.

How This Reflects Across Key Reports
Trip Reports Are Becoming More Insightful
Trip reports used to focus on distance and duration. Now, they highlight efficiency gaps.
They make it easier to spot:
- High idle time compared to running time
- Uneven trip distribution across vehicles
- Frequent stoppages and delays
- Driving behavior issues like overspeeding
They also guide improvements such as:
- Reducing idle time
- Balancing workload
- Improving driving habits
👉 The outcome is simple—better utilization and improved fleet performance.
Travel History Starts Telling a Story
Travel history is no longer just a movement log. It now reveals how effectively the day is being used.
It helps identify:
- Frequent stops and long idle gaps
- Short or fragmented movements
- Underutilization between trips
- Irregular movement patterns
It also brings forward opportunities like:
- Reducing time loss during the day
- Optimizing routes for smoother flow
👉 The result is better daily efficiency and improved operational planning.
Speed Reports Go Beyond Surface-Level Data
Speed vs distance reports are becoming more strategic. They now connect speed patterns with real business impact.
They highlight:
- Dominant speed ranges across the fleet
- Uneven usage of vehicles
- Underutilized or inactive units
- Overuse of certain vehicles
They also uncover:
- Workload imbalance
- Risk of driver fatigue
- Maintenance signals
And suggest actions like:
- Balancing fleet usage
- Improving deployment strategies
👉 This leads to safer driving and more balanced fleet operations.
Why This Shift Is Creating New Opportunities
As fleet businesses evolve, their expectations from technology are rising.
Basic tracking is no longer enough. There is a clear demand for solutions that simplify decisions and add measurable value.
This opens up strong opportunities to:
- Offer more value-driven fleet solutions
- Move beyond basic telematics reports
- Position offerings as decision-making tools
- Build stronger, long-term client relationships
- Increase overall solution value and margins
In short, smarter reporting is becoming a key differentiator.
Where This Makes an Immediate Impact
This approach fits across multiple industries without any friction.
- Logistics & transportation
Improves trip efficiency and reduces delays - School transport
Enhances safety and reduces unnecessary idle time - Delivery & last-mile fleets
Optimizes routes and minimizes time gaps
The impact is consistent—better insights lead to better decisions.
The Business Impact Behind the Change
When reports become easier to understand, operations naturally improve.
- Saves time spent on manual analysis
- Reduces operational inefficiencies
- Speeds up decision-making
- Improves fleet utilization
- Enhances service quality
- Increases overall client satisfaction
It’s a direct shift from effort-heavy analysis to outcome-driven action.
The Bigger Picture: Where Fleet Technology Is Headed
This evolution is shaping the future of fleet management software.
- Smarter and more intuitive fleet reports
- Deeper insights through AI fleet analytics
- Reduced manual work with automated reporting
- More meaningful telematics reports
Fleet technology is moving from tracking to intelligence—and that’s a big leap forward.

Closing Thought: When Reports Start Driving Decisions
Fleet data has always been powerful.
But its true value lies in how easily it can be acted upon.
As reporting becomes more contextual and insight-driven, it turns into something much more valuable – a tool that doesn’t just show data, but helps drive decisions.
And in a competitive market, that’s exactly where the real advantage begins.