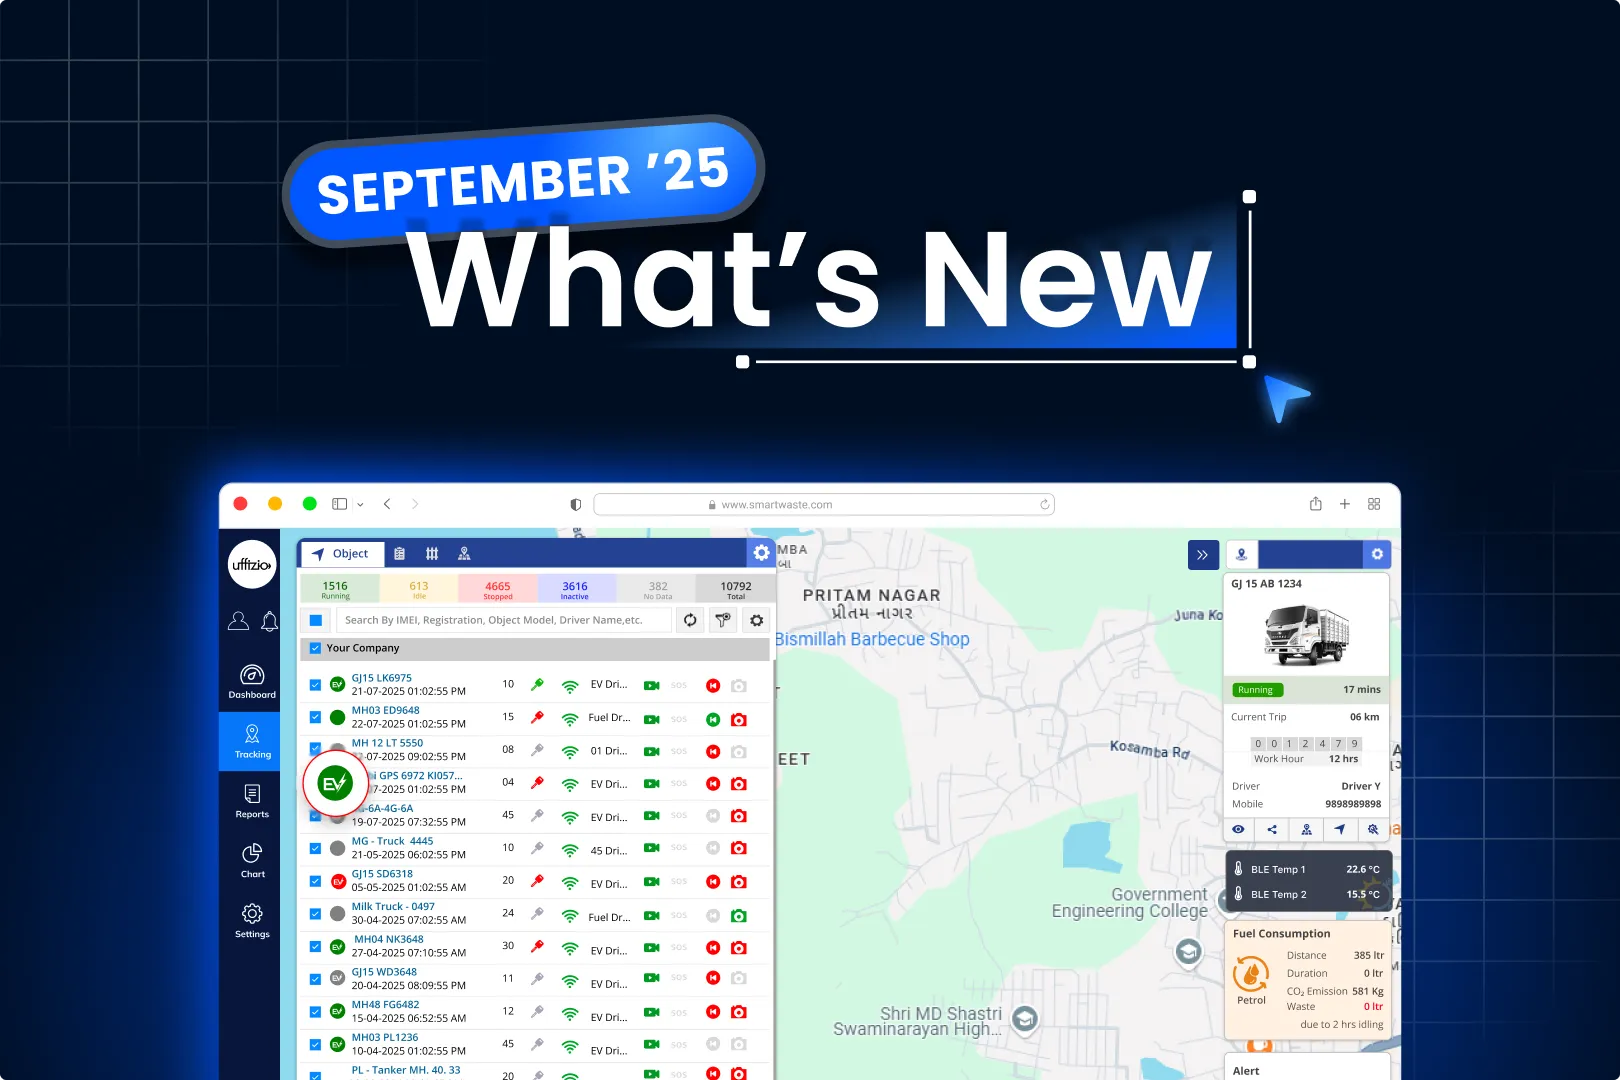
At Uffizio, we believe great software keeps evolving, shaped by the people who use it every day. Every update you see here is built from real feedback, real challenges, and real ideas shared by our clients and users around the world. Whether it’s improving fuel accuracy in Trakzee, adding smarter tools to SmartWaste, or making Trakzee Mini more intuitive, our goal stays the same: to make every task simpler, faster, and more reliable.
Here, you’ll find all the latest enhancements and new features that make our GPS tracking and fleet management platforms even stronger.
1. Trakzee updates
1.1 Smarter fuel refill detection
Many times, fleets saw false fuel refill alerts just because the vehicle was moving. This caused confusion and made it harder to trust the data. To solve this, we’ve added a speed limit filter in the fuel calibration settings. Now, if the vehicle is moving faster than the set speed, Trakzee will simply ignore that refill event.
This means:
- No more wrong refill readings while vehicles are on the move.
- Cleaner and more accurate fuel reports.
- Less time wasted double-checking false events
With this update, fuel monitoring becomes more reliable, giving managers and drivers peace of mind.
1.2 Set your own action favourites in the mobile application
We know that every user works differently. Some actions are used all the time, while others are hardly ever used. To make life easier, the mobile app now comes with a favourite option for action buttons. Here’s how it helps:
- You can pick up to 3 favourite actions (or none if you like).
- Playback will always be there as the default.
- If your widget rights are removed, the option will disappear automatically.
- And the best part is that these favourites are saved just for you, so every user gets their own personalised set.
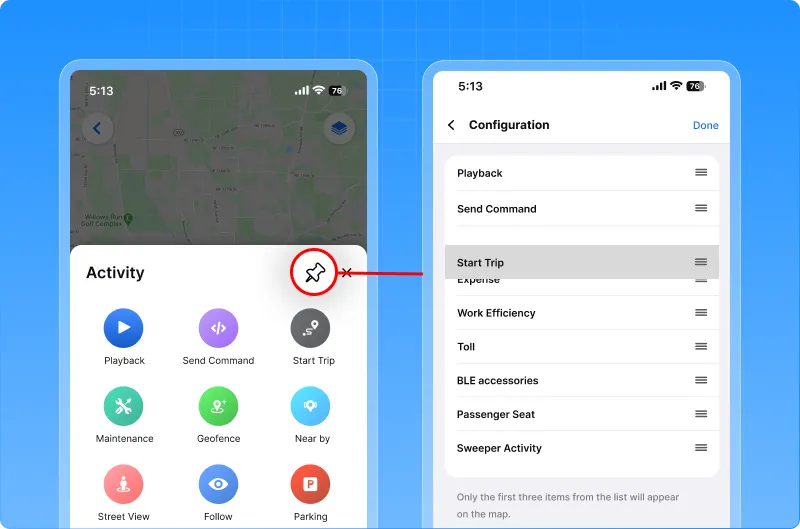
With this change, the features you need most are always just a tap away.
1.3 Find widgets faster with the search bar in live tracking
Scrolling through a long list of options can be tiring. To make things easier, we’ve added a search bar in the tooltip widget settings on live tracking. Now you can simply type the name of the widget you want, and the list updates instantly. No need to dig through the entire list.
Here’s what you get:
- Quick search with instant results as you type.
- Works even with partial matches or different cases.
- A clear “No such widgets found” message if nothing matches.
![]()
With this update, finding and selecting widgets is faster, smoother, and hassle-free.
1.4 Better tracking with alert-based playback for route deviation
Playback now shows route deviations only when a real alert is triggered. The red line will appear for the exact duration of the deviation alert, from start to end. This makes playback maps more reliable and easy to understand, giving you a clear picture of your vehicle’s journey.
![]()
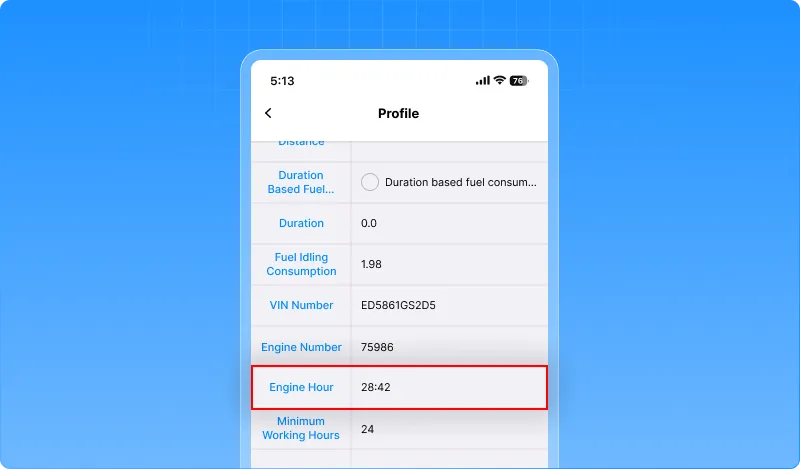
1.5 Engine hour settings now on mobile
Managing engine hours is now more convenient. The engine hour field, earlier available only on the web, has been added to the mobile app. You can now view, add, or edit engine hours directly from your phone, right below the Engine Number field. The field uses the same format and validations as on the web, ensuring accuracy and consistency across both platforms.
This update makes it easier to keep engine details up to date, whether you’re in the office or on the move.
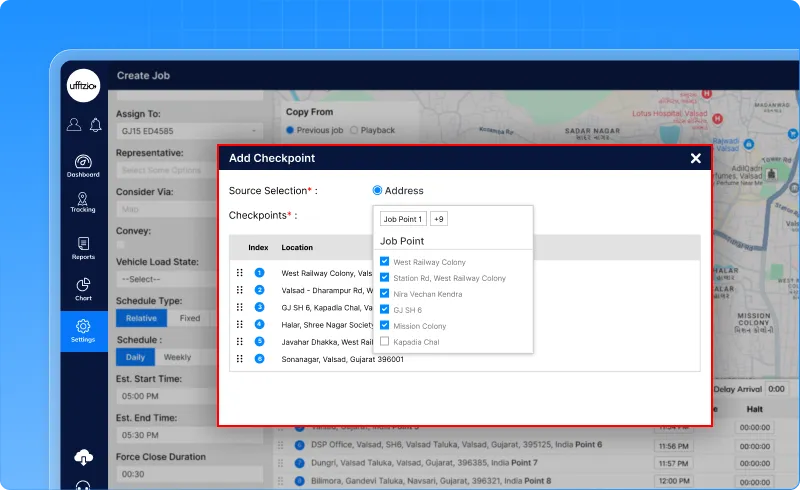
1.6 Plan jobs faster by adding multi-checkpoint
We know how tiring it can be to add checkpoints one by one when planning a job. For routes with 30, 50, or even 100+ stops, it often feels endless.
That’s why we’ve made it simpler. Now, when creating a job, you can add multiple checkpoints at once. Just pick them directly from your address list or use a ready-made group of addresses. With a few clicks, all your checkpoints are added together. You still have full control — edit or remove any checkpoint later. But the long hours of repeating the same steps are gone. This update makes job planning quicker, smoother, and a lot less frustrating.
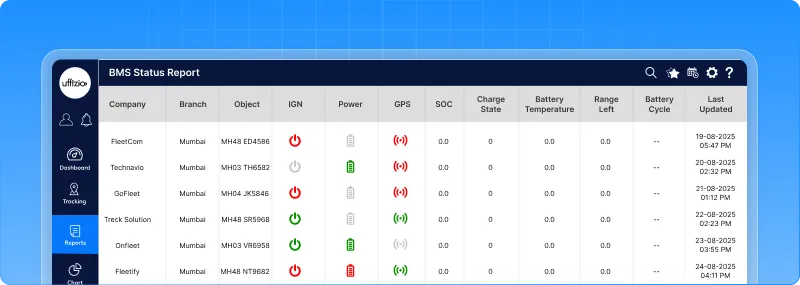
1.7 New battery management status report for EV fleets
Managing electric vehicles is all about keeping an eye on the battery. To make this easier, we’ve added a brand-new BMS status report in Trakzee.
With this report, fleet managers can now track key battery details in real time, such as:
- State of charge (SOC)
- Battery temperature
- Range left
- Charge state and battery cycles
Filters make it simple to view data by company, branch, or vehicle, while real-time updates ensure you always see the latest status. You can even click on rows to dive deeper into specific vehicles. This report gives you a clear picture of battery health across the fleet, helping you plan better, prevent issues, and keep EV operations running smoothly.
1.8 More accurate work hour tracking with CANbus
Tracking vehicle work hours is now more reliable. We’ve enhanced the Work Hour Summary Report by adding CANbus-based engine work time. With this update, you can:
- Use engine hour data directly from the vehicle’s ECU instead of only relying on sensors.
- See Start Engine Hour and End Engine Hour values for every trip in HH:MM format.
- Choose between Port-based data (traditional method) or CANbus-based data (more accurate).
This gives fleet managers a clearer and more dependable view of how long vehicles actually run, helping improve planning, billing, and overall fleet efficiency.
![]()
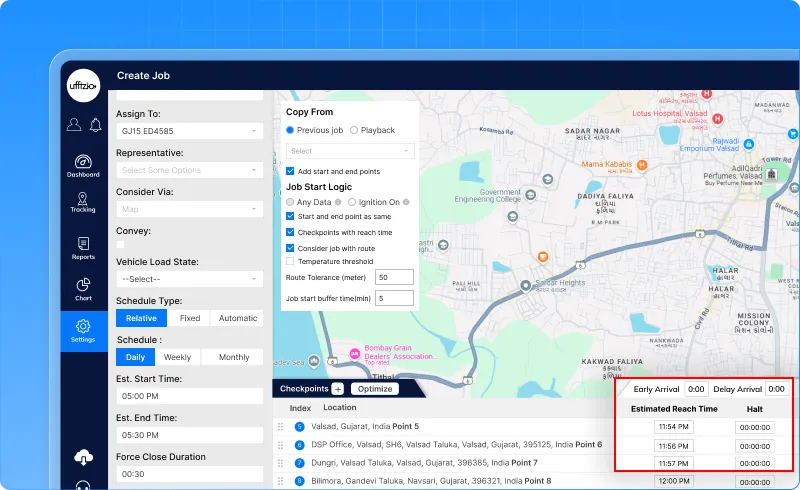
1.9 Adjust stops without recreating jobs
Routes often change, and jobs need to change with them. Until now, once a job was saved, halt points couldn’t be adjusted — even for small changes. With this update, you can now add, edit, or remove halt points in saved jobs. Any edits you make will apply to upcoming schedules, while past jobs remain untouched.
This gives your clients:
- Flexibility to adjust halt times, names, or durations.
- Control to add or remove stops without recreating the whole job.
- Confidence that historical records stay accurate and unchanged.
1.10 Fuel expense vs. refill report
For many fleets, checking fuel card statements against actual refuel data was a daily headache. Managers had to manually compare numbers, line by line, across different sources. It was slow, error-prone, and left plenty of room for mismatches to slip through.
We’ve fixed this with the new fuel expense vs. refill report. Now, the system does all the heavy lifting for you. Simply upload your fuel card file, and the report instantly compares it with platform-recorded refuel events.
- The summary view gives a quick, vehicle-wise snapshot of differences.
- The detail view lets you dive into each day’s fuel activity for clarity.
- Everything can be exported for audits, making expense checks simple and transparent.
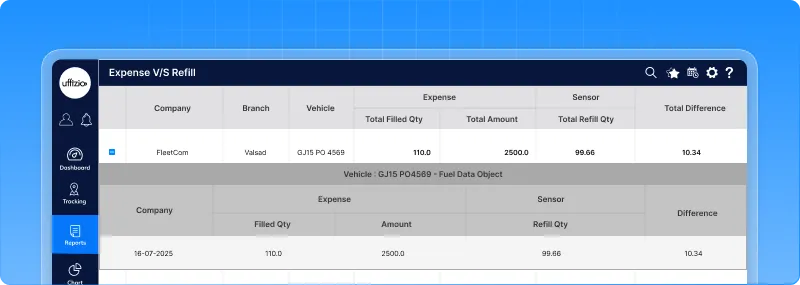
This enhancement saves hours of manual work, cuts down on mistakes, and gives you peace of mind knowing that every fuel entry is validated.
1.11 Time range filter for driver behaviour reports
Reviewing driver behaviour often meant going through long stretches of data without being able to focus on a specific time window. This made it harder to study patterns or pinpoint issues.
To make things easier, we’ve added a Time Range filter across all Driver Behaviour reports — including Driver Activity, Driver History, Driver Trips, Driver Work Hour, Driver Performance, Driver Rating, ADAS/DMS, and more.
Now, you can:
- Narrow down reports to the exact hours you want to study.
- Export or schedule filtered reports with just the relevant data.
- Spend less time searching and more time understanding driver performance.
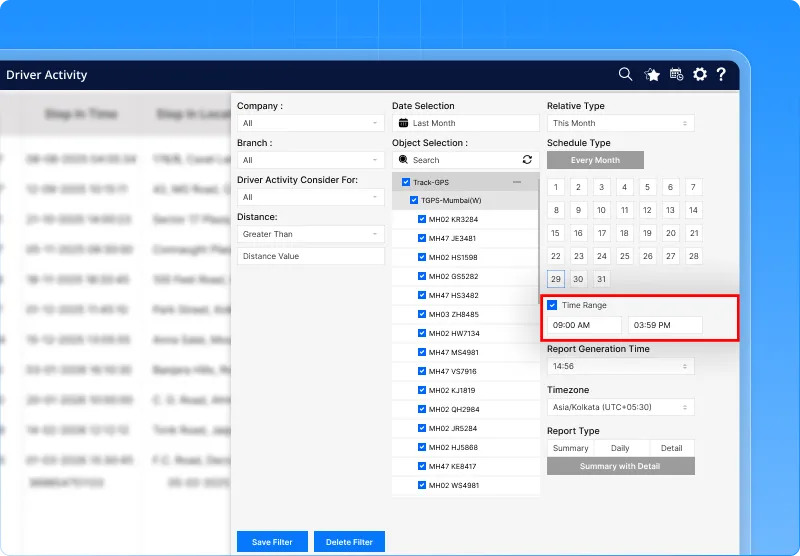
This update gives managers sharper insights and more control over how they analyze driving behaviour.
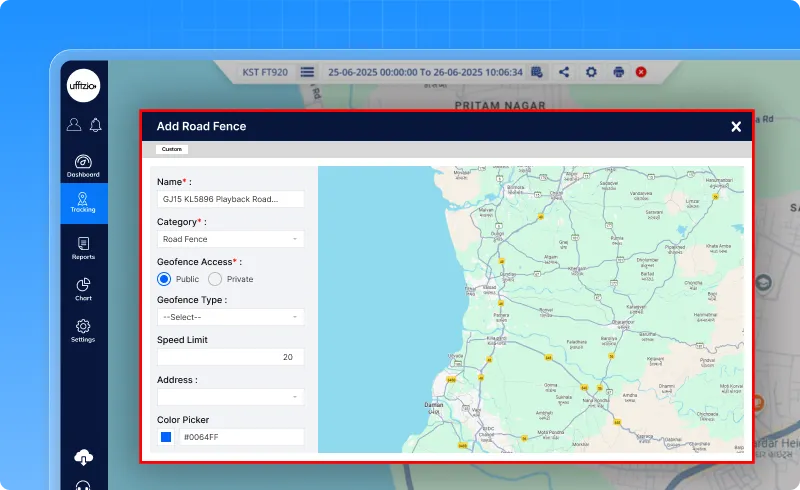
1.12 Turn playback trips into road fences
This new update makes setting road fence much easier. From the playback screen, you can simply click “create road fence.” The system will take the same path your vehicle travelled and use it to build the fence for you. You can give it a name, add details, or adjust it if needed. Once saved, it appears in your road fence list, ready to edit or manage later.
This update saves time and makes road fence creation simple, quick, and precise.
1.13 EV playback details on live tracking
Monitoring electric vehicles requires different insights than fuel-based vehicles. To make this easier, we have added a new playback details tab on the live tracking screen, designed especially for EV fleets. Now, you can clearly see:
- Battery consumption across the trip
- Battery temperature during operation
- Energy consumption patterns
- Voltage vs. Current performance
- Trip efficiency in one glance
![]()
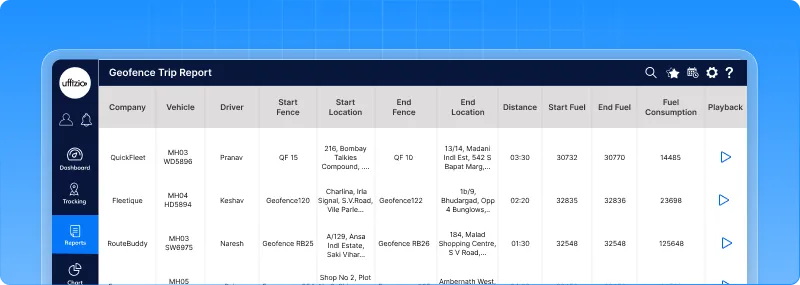
1.14 Start and end fuel levels in geofence trip report
Fuel tracking just got clearer. The geofence trip report now shows both the start fuel level and end fuel level for every trip. Here’s what this means for you:
- See exactly how much fuel was in the tank when a vehicle entered and exited a geofence.
- Compare start and end values alongside total fuel consumption.
- Get a more transparent view of fuel usage across trips.
With this update, analyzing fuel performance within geofenced routes becomes more accurate and consistent with other fuel reports.
1.15 New EV icons in live tracking
Keeping track of EV status is now easier with new icons on the live tracking screen. These icons give you a quick, clear view of important battery parameters without needing to open detailed reports.
Here’s what you’ll see:
- State of Charge (SOC): A battery icon that changes color and level (green, yellow, red) to show remaining charge.
- State of Health (SOH): A health-style battery icon to show the overall condition of the battery.
- Battery Temperature: A thermometer inside a battery, with colors to show if it’s too cold, normal, or overheated.
- Charging Status: A plug + battery icon that updates in real time to show whether the vehicle is charging, discharging, or idle.
![]()
With these new visuals, fleet managers can instantly understand battery health and status at a glance, making EV monitoring faster and more intuitive.
1.16 IP camera now streams inside GPS tracking
Sometimes, numbers on a screen aren’t enough — you need to see what’s happening in real time. With this update, vehicles equipped with IP cameras can now stream live video directly inside the GPS platform. Here’s how it works:
- A green live streaming icon shows up for vehicles with active IP cameras.
- Click the icon to open a video panel and view the live feed instantly.
- Supports multiple cameras per vehicle, with streams playing directly from configured URLs.
- Works smoothly on both web and mobile.
![]()
This feature gives you instant visual monitoring, helping you improve security, verify incidents, and make faster decisions — all without switching between systems.
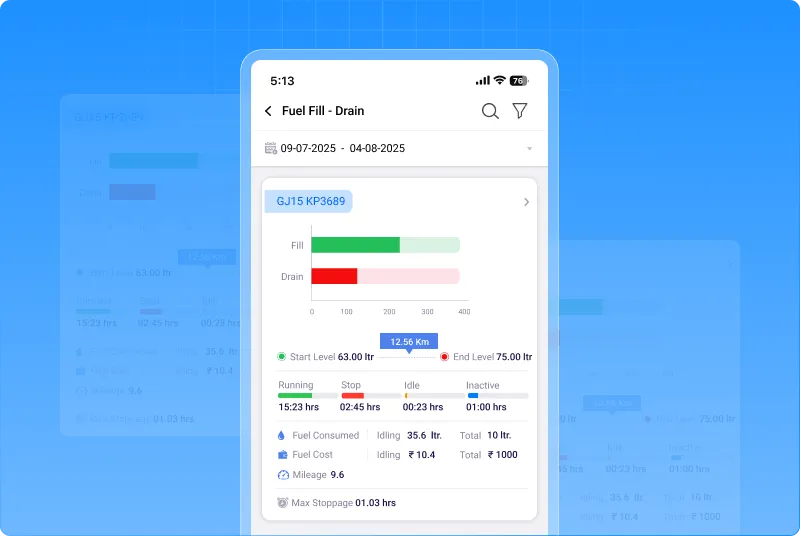
1.17 Fuel fill-drain report with more transparency
Understanding where your fuel goes is now easier. The Fill-Drain Report has been enhanced to show a clear breakdown of consumption:
- Running Consumption – fuel used while the vehicle is moving.
- Idling Consumption – fuel used while the vehicle is stationary.
- Total Consumption – the sum of both values.
![]()
This breakdown is available on both web and mobile, and also in exports (Excel, PDF, CSV). With this added clarity, managers can better track fuel use, cut down on wastage, and make smarter operational decisions.
1.18 New EV widgets on live tracking
Managing EV fleets needs more than just location data — you need to keep an eye on the battery at all times. To make this simple, we’ve added new EV widgets to the Live Tracking screen. These widgets give you quick insights into:
- Battery Analytics: SOC, voltage, temperature, charge cycles, and health — all in one view.
- Charging Insights: Real-time charging progress, last charging location, energy added, and even cost estimates.
- Energy Consumption: Track energy used per distance, see idling consumption, and spot usage trends with easy graphs.
- Battery Thermal Map: A heatmap view of battery temperature ranges, with alerts if cells cross safe limits.
![]()
Each widget updates in real time and is designed for clarity, whether you’re on desktop or mobile. With these visuals, spotting issues and making decisions for EV fleets is faster and smarter than ever.
1.19 Media gallery now on mobile
Checking driver events or safety footage no longer requires you to log in from a desktop. With the new media gallery in the trakzee mobile app, you can now view, filter, and download event-based media right from your phone.
Here’s what you can do:
- View event footage like forward collision warnings, fatigue driving, and snapshots in a clean card view.
- Filter easily by company, branch, vehicle, event type, or date range.
- See details at a glance — vehicle number, timestamp, file size, and even map location pins.
- Play or download media instantly, with smooth playback optimized for mobile.
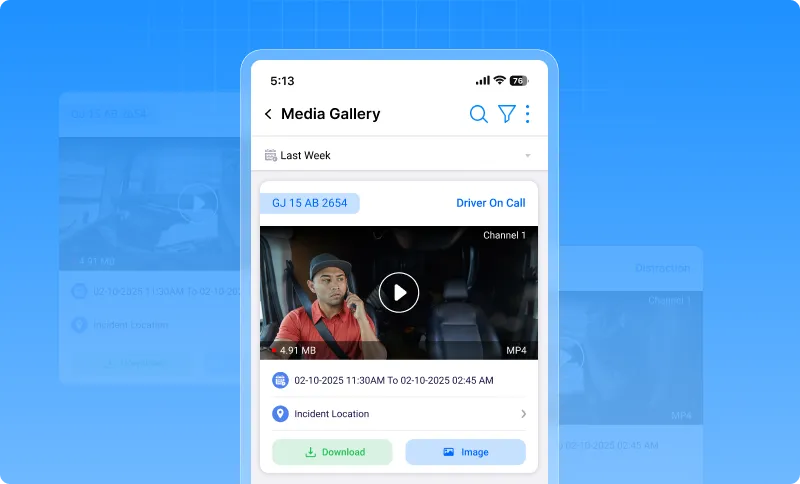
Whether it’s ADAS/DMS alerts or historical videos, everything you need is now in your pocket. This update brings the full power of the media gallery to mobile, making monitoring and evidence management faster and more convenient.
1.20 Temperature alerts that focus on what matters
Temperature alerts are important, but sometimes they pop up when they’re not needed — like during loading or unloading, where short-term temperature changes are normal.
With this update, you can now exclude specific addresses (such as warehouses or delivery points) from triggering temperature alerts.
Here’s what it means for you:
- Select one or more addresses to exclude when setting up a temperature alert.
- Alerts won’t trigger at those locations, even if the temperature briefly crosses the threshold.
- Once the vehicle leaves those locations, alerts work as usual.
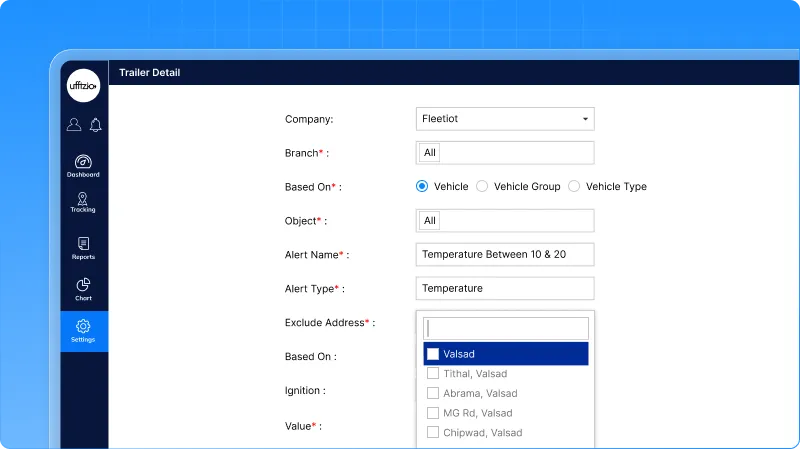
This makes alerts more meaningful, reduces false notifications, and ensures you only get notified when it truly matters.
1.21 Driver-centric ADAS/DMS event tracking
ADAS and DMS events are most useful when you know exactly who was driving at the time. Until now, these reports showed events but not the driver behind them.
With this enhancement, driver details are now included in both Object and Driver ADAS/DMS reports. The system uses a smart mapping logic — checking iButton, RFID, Beacon, or default driver assignments — to link events to the right driver.
Here’s what changes:
- Object ADAS/DMS Events (Detail View): Driver name is now shown alongside each event.
![]()
- Driver ADAS/DMS Events (Summary View): Reports can be grouped by driver for a clearer view of behavior trends.
![]()
- Works on both web and mobile, with accurate details in scheduled and exported reports.
This gives fleet managers stronger insights into driver performance, improves accountability, and makes compliance checks much easier.
1.22 Smarter parking reports for every vehicle
Keeping track of where vehicles are parked is now much simpler. With the new Parking Location Report, you can map each vehicle to a predefined parking spot and instantly see whether it’s parked in the right place.
Here’s what the report shows:
- Parking compliance — is the vehicle within the defined radius of its assigned spot.
- Distance from parking location — how far the vehicle is from where it should be.
- Full details — current coordinates, speed, driver name, and parking duration.
- Flexibility — generate in real time or schedule daily, weekly, or monthly reports.
- Exports — download in PDF, Excel, or CSV, or receive reports via email.
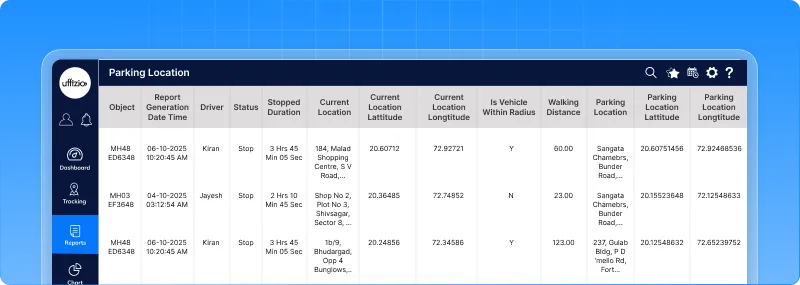
This update makes it easy to monitor parking compliance, reduce misuse, and keep parking operations under control.
2. SMARTWASTE updates
2.1 Collector and helper allocation made easy
Managing waste collection often means dealing with sudden changes — a helper might be unavailable, or a collector may need to switch routes mid-job. Until now, these changes were limited and only worked for upcoming jobs.
With this update, you can now modify collector or helper assignments for both upcoming and in-progress jobs directly from the Job Tracking screen.
Here’s what’s new:
- Permanent or Temporary changes: Decide whether the reassignment should apply only for the current job or carry forward for all future schedules.
- Real-time flexibility: Make changes on the go, even while a job is already in progress.
- Clear audit trails: Every change is logged with job ID, old and new collector/helper, job status, and timestamp.
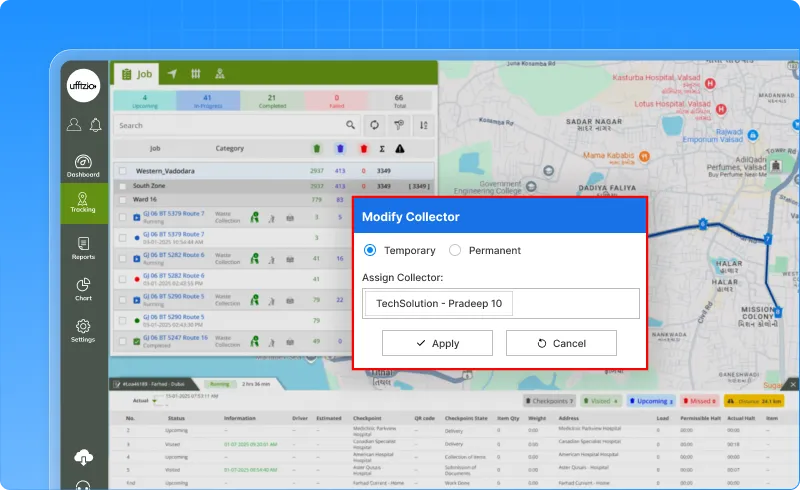
This gives supervisors the flexibility to respond quickly to workforce changes, keep operations running smoothly, and maintain full accountability.
2.2 Easier playback controls
Watching playback is now more flexible in SmartWaste. We’ve made two key improvements to give you better control over the screen and settings. Here’s what’s new:
- Drag to resize: The playback details window can now be resized by dragging it vertically. This makes it easier to balance map view and data grid without endless scrolling.
- Playback settings toggle: Closed the settings window by mistake? No problem. A new button in the map tools lets you reopen it instantly, without refreshing or restarting playback.
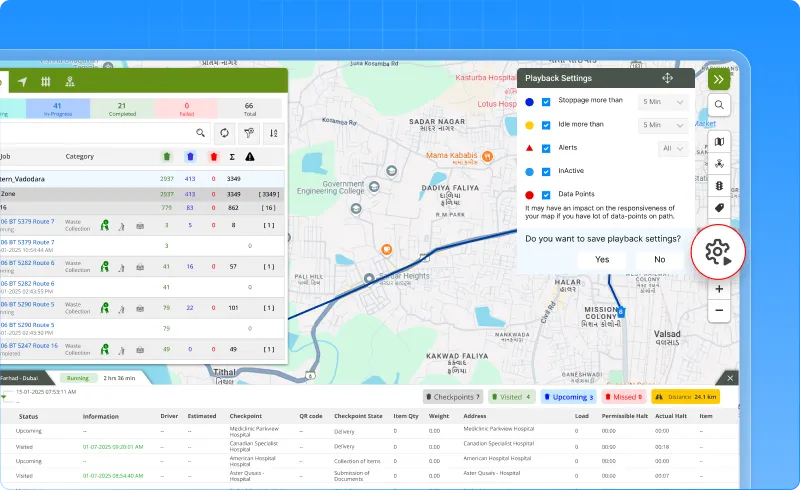
These small but powerful changes make playback smoother, clearer, and much easier to use in day-to-day operations.
2.3 Re-center button for live tracking
Inspecting bins or zooming into a specific map area often got interrupted because the map kept snapping back to the vehicle whenever new data arrived.
To fix this, we’ve added a new Re-Center button on the Live Tracking screen.
Here’s how it works:
- Enabled (default): The map will stay centered on the vehicle as live data comes in.
- Disabled: You can freely explore and zoom into the map without being pulled back to the vehicle.
- Session-friendly: The setting stays as you choose until you log out or change it again.
![]()
This gives you full control over your map view, so you can focus on what matters without distractions.
2.4 Owner details in bin information and reports
Sometimes managers need to quickly verify service or resolve an issue at a bin. Until now, they had to rely only on the location data shown in Live Tracking or reports.
With this update, Owner Name and Owner Mobile Number are now visible in two places:
- Live Tracking (Bin Popup): When you click on a bin, you’ll see the owner’s name and contact number alongside time, vehicle, and address details.
- Checkpoint Status Report: Exports (Excel/PDF) now include owner details right after the collection address, for complete and transparent records.
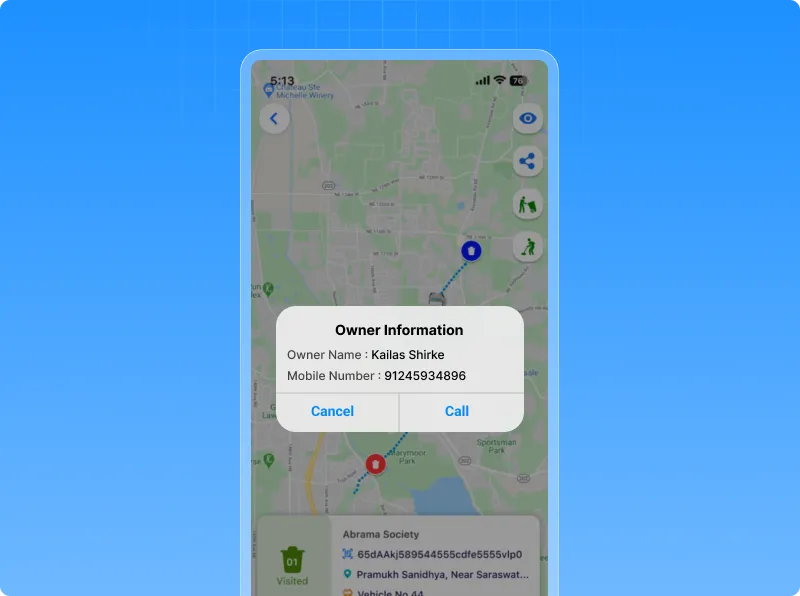
This enhancement makes it easier to directly contact bin owners when needed, while also ensuring reports carry all the context for follow-ups and audits.
3. Trakzee Mini updates
3.1 Trip images now in playback
Revisiting a past trip is now more visual and useful in Trakzee Mini. With this update, you can view, preview, and download images captured during your trips – all directly from the Playback screen.
Here’s what you can do:
- Tap the new image icon on the Playback screen to see all trip images in one place.
- Browse images in a thumbnail grid, shown in order of when they were taken.
- Click any thumbnail for a larger preview with time and location details.
- Download images one by one or export the entire set in one go.
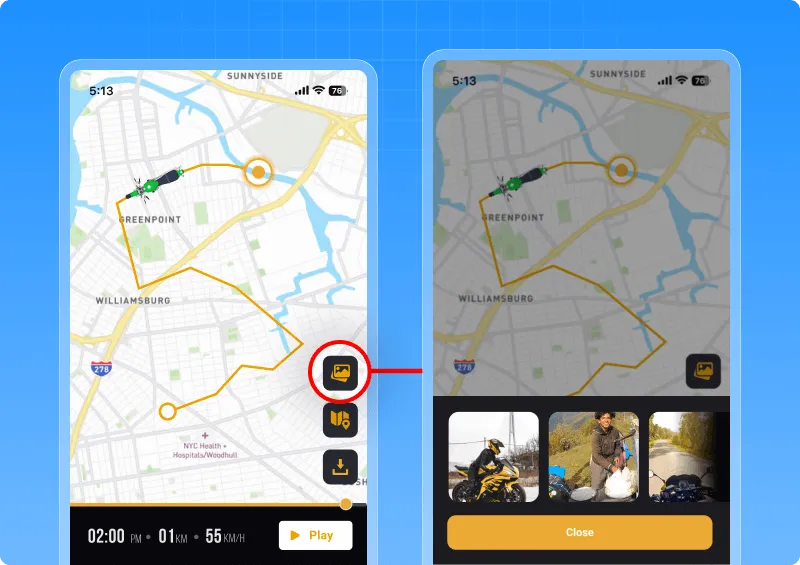
This makes it easier to validate trips, check incidents, or keep records — with every captured image just a click away.