This month’s enhancements are focused on making everyday operations more efficient, intuitive, and insight-driven. From improved visibility to smarter workflows, each update is designed to simplify how teams manage vehicles, workforce, and data while reducing manual effort and confusion.
1. Trakzee Updates
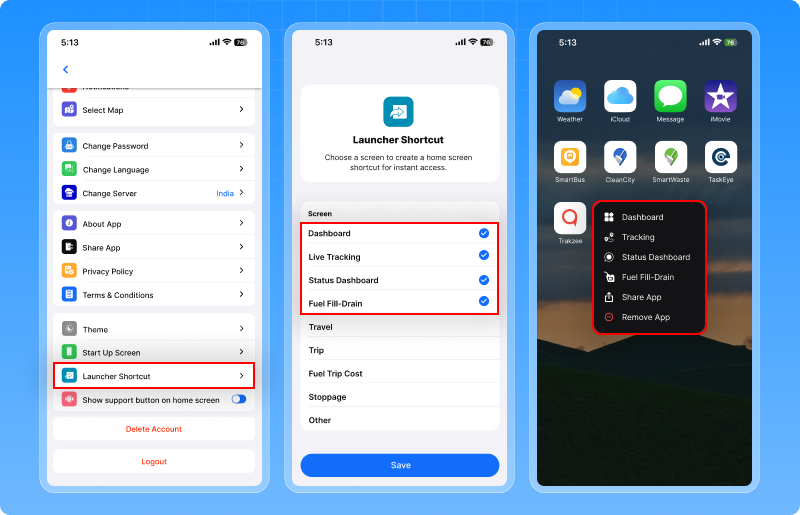
1.1 Your most used screens, right on your home screen
Think about how often you open the app just to reach the same screens. Live tracking, reports, trips. Same steps, every time. Now, you can skip all that.
What’s changed
You can now set your favorite screens as shortcuts and access them directly from the app icon. Just long-press the Trakzee app icon, and your selected screens appear instantly. Tap and go — no need to open the app and navigate.
Set it up once
From settings, choose up to 4–5 screens that you use the most. These shortcuts are saved for you and stay available even after restarting the app.
Why this matters
- Saves time on daily operations
- Reduces repeated navigation
- Makes the app feel faster and more personal
Now your important screens are not inside the app they’re right on your home screen.
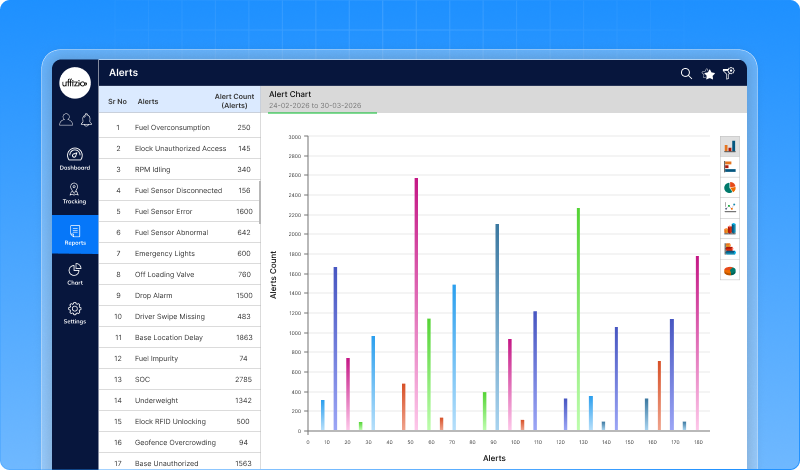
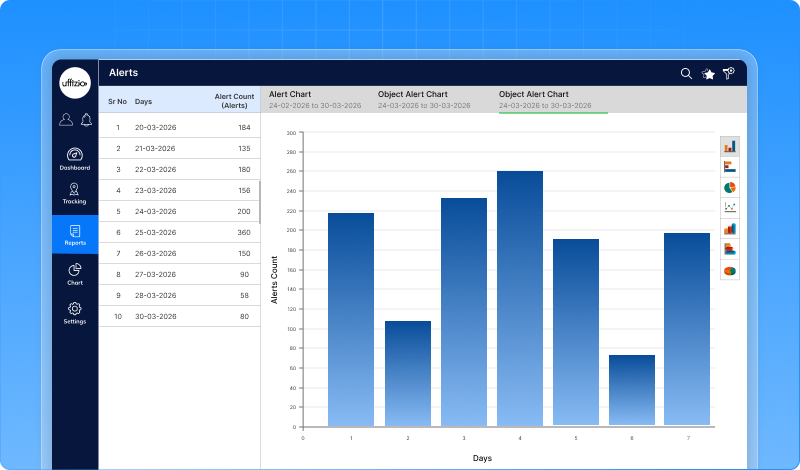
1.2 Understand alerts better with smarter chart view
When managing a large fleet, alerts can quickly become overwhelming. The real need is simple see what’s happening first, then go deeper if needed. That’s exactly what this enhancement does.
What’s improved
You can now select any number of vehicles the earlier limit is removed. But the biggest improvement is how the data is shown.
See the big picture first
The chart now starts with a simple summary:
- Total alerts grouped by type
(like Speeding, Power, Zone alerts)
This helps you quickly understand which alert needs attention the most.
Know which vehicles are involved
Click on any alert type. Now you’ll see which vehicles are generating those alerts.
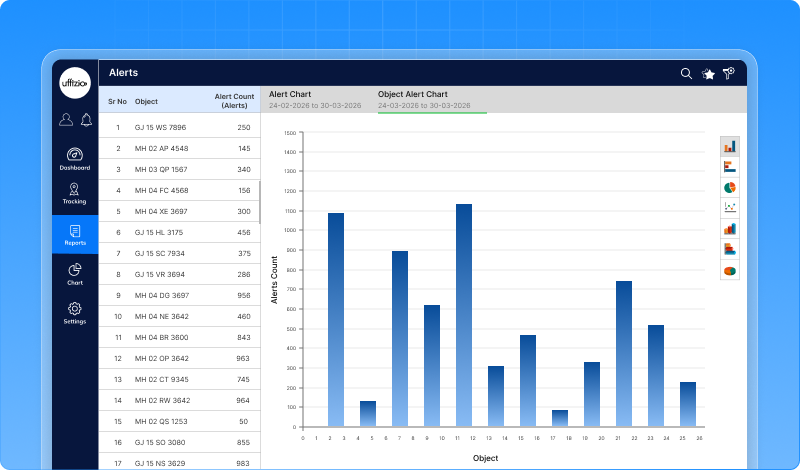
See when it happened
Click again on a vehicle. Now you can see day-wise alert details for that vehicle.
Why this matters
- No restriction on selecting vehicles
- Clear view of alerts at a glance
- Easy step-by-step analysis
- Faster understanding of issues
Now, instead of getting lost in data you can start simple and go deeper only when needed.
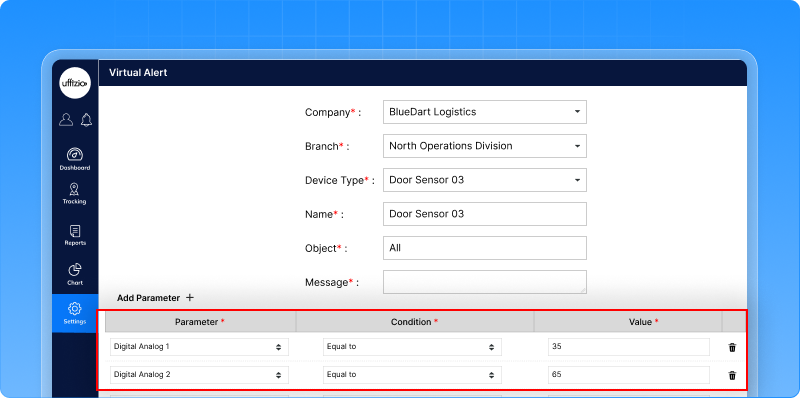
1.3 Create alerts exactly the way you need
Every fleet has different monitoring needs. Sometimes one condition is not enough. You may want to trigger an alert only when multiple things happen together. Earlier, alerts were limited to a single sensor or condition. Now, with virtual alerts, that limitation is removed.
What’s improved
You can now create custom alerts based on your own rules.
- Define alerts using specific conditions and values
- Combine multiple sensors or inputs into one alert
For example, instead of tracking just one parameter, you can now create alerts that depend on multiple conditions together. This makes alerting more accurate and better suited for real-world scenarios.
Why this matters
- More flexibility in alert setup
- Better control over what should trigger an alert
- More accurate monitoring for complex conditions
Now alerts are not just predefined they are built around how your operations actually work.
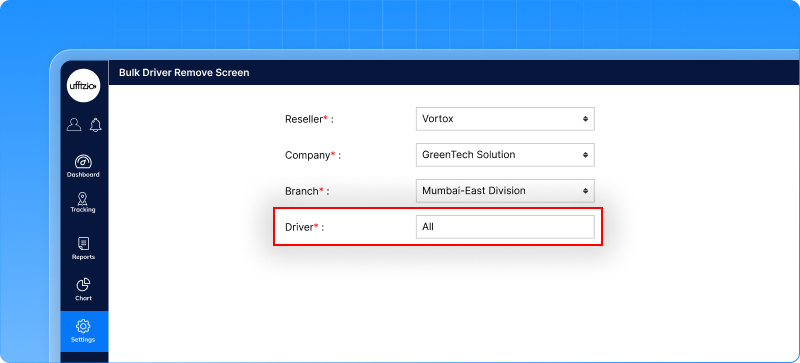
1.4 Delete multiple drivers in one go
There are times when driver records need to be cleaned up. Maybe drivers are inactive. Maybe data needs to be updated. Earlier, this meant going through the list and deleting each driver one by one. It worked but it felt repetitive and time-consuming. Now, you can do it all at once.
What’s changed
A new option lets you select multiple drivers and delete them in one go. You can filter drivers by company, branch, or search for specific names then select the ones you want to remove. Once selected, delete them in a single action. The system will ask for confirmation before completing the process.
Why this matters
- Faster cleanup of driver data
- Less repetitive work
- More control when managing large records
Now managing driver data feels less like a task and more like a quick action.
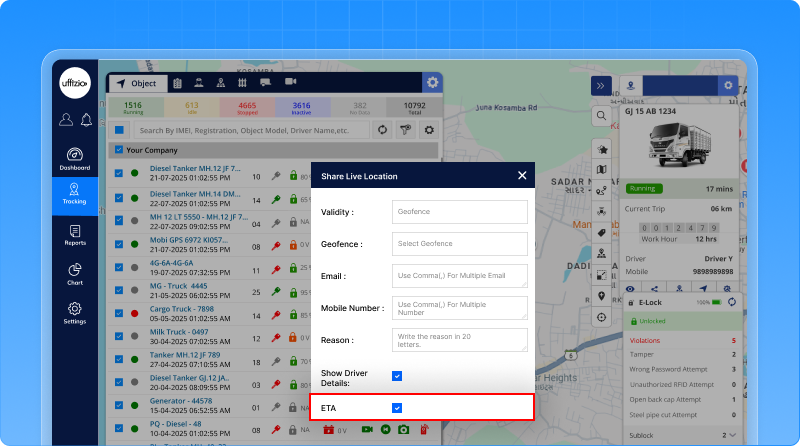
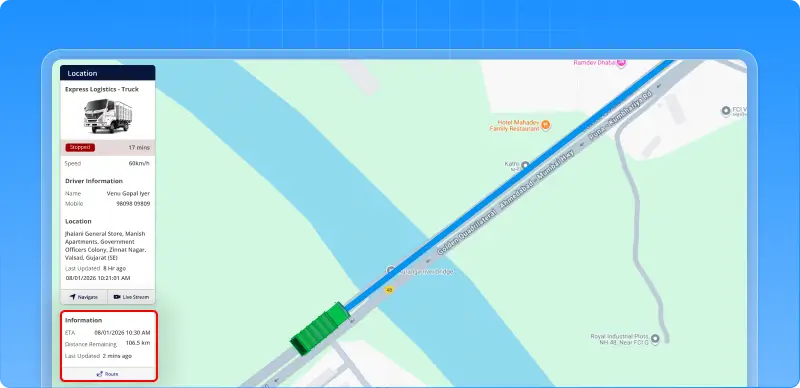
1.5 Know when the vehicle will arrive with shared location
Sharing a vehicle’s location is helpful. But people usually want one more thing: “When will it reach?” Now, the shared location link answers that too.
What’s updated
When you share a vehicle’s location (for a specific address or geofence), the link now also shows the expected arrival time (ETA).
Anyone with the link can:
- See where the vehicle is
- Know how far it is
- And understand when it will reach
All this without logging in.
How It works
- ETA is shown only when sharing a single vehicle
- It works when the destination is an address or geofence
- ETA keeps updating as the vehicle moves
Why this matters
- Clear visibility for customers and recipients
- Fewer calls asking for arrival updates
- Better planning and coordination
Now, shared location is not just about tracking it’s about knowing exactly when to expect the vehicle
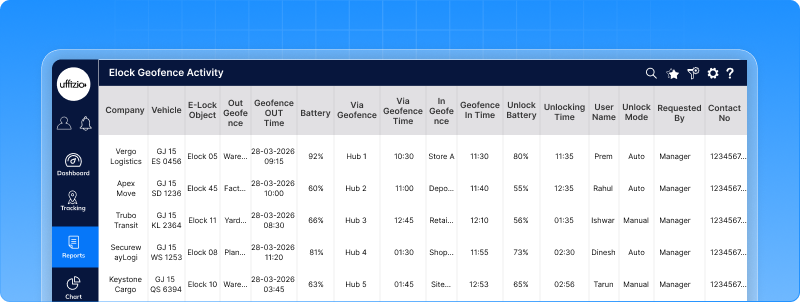
1.6 Track every e-lock movement in one report
When managing E-Lock operations, one question often comes up: Where was the lock opened, where was it closed, and what happened in between? Earlier, this information was available but scattered across different places. It made tracking the full journey of an E-Lock activity difficult. Now, everything comes together in one place.
What’s updated
A new E-Lock geofence activity report is introduced. This report shows the complete journey of an E-Lock event:
- Where the lock was applied
- Where it was unlocked
- Any geofence visited in between
- Time taken and distance travelled
All in a single view.
What you can see
- Lock and unlock locations (with geofence)
- Locking and unlocking time
- Transit time between lock and unlock
- Distance travelled during that period
- Battery level at lock and unlock
- Who performed the unlock and how
If the vehicle passes through another geofence in between, that is also captured.
Why This Matters
- Clear visibility of full E-Lock activity
- Easier tracking of vehicle movement between locations
- Better control and audit of lock/unlock actions
- All details available in one report
Now, instead of checking multiple places you can see the entire E-Lock journey in one report.
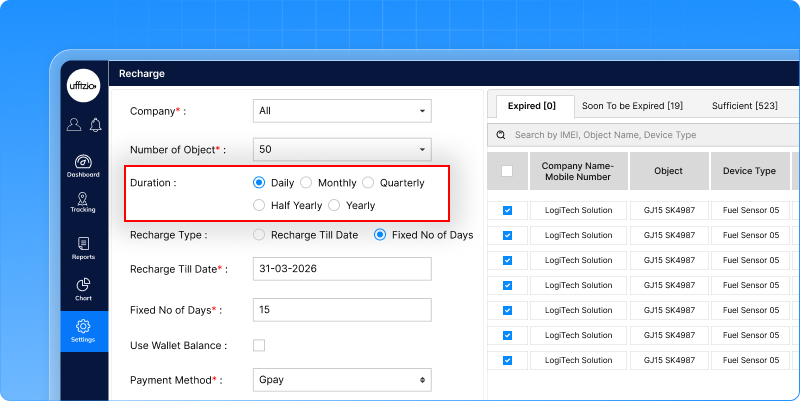
1.7 Recharge vehicles for exactly the days you need
Earlier, vehicle recharge worked only on fixed plans like monthly or yearly. But in real operations, that doesn’t always fit. Sometimes you need to recharge for just a few days. Or align multiple vehicles to the same expiry date. Now, you can do that easily.
What’s updated
A new Daily recharge option is now available. This means you can:
- Recharge a vehicle for any number of days
- Or simply select an expiry date, and the system will calculate the cost
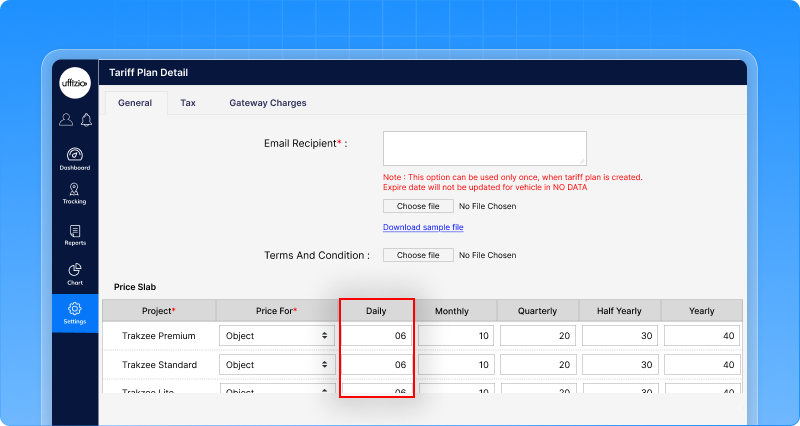
How it works
- Shorter recharge periods
No need to pay for a full month if you only need a few days - Same expiry for multiple vehicles
Easily align all vehicles to one common renewal date - Simple date-based recharge
Just pick a date the system handles the calculation
Why this matters
- More flexibility in billing
- Better control over renewals
- Pay only for what you actually use
Now recharge is not fixed it’s as flexible as your operations.
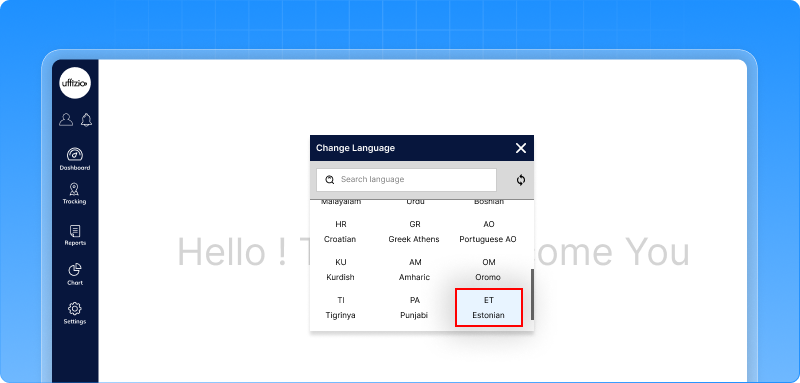
1.8 Use the platform in Estonian language now
The platform is now available in Estonian, making it easier for teams in Estonia to use the system in their native language.
Why this matters
- Easier to understand and use
- Better experience for local teams
Now the platform feels more familiar and user-friendly for Estonian users.
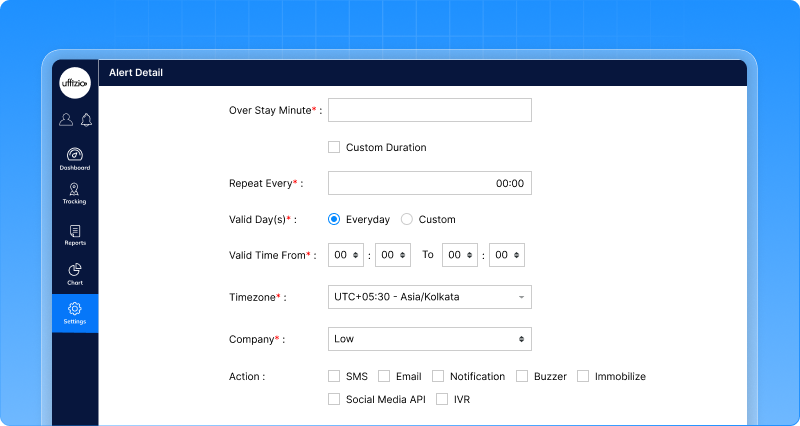
1.9 Take instant action on overstay with buzzer & immobilize
When a vehicle stays longer than expected at a location, quick action becomes important. Earlier, the system would show an alert but action still depended on someone noticing it in time. Now, the system can act instantly.
What’s updated
When an Overstay Alert is triggered, you can now:
- Play a buzzer sound to get immediate attention
- Immobilize the vehicle automatically
This means the system doesn’t just notify it can also take action.
Why this matters
- Instant awareness with buzzer alerts
- Quick control over vehicles in overstay
- Reduced dependency on manual monitoring
- Better safety and operational control
Now, overstay is not just detected it’s handled immediately.
1.10 Accurate flow meter readings with unit selection
When monitoring fuel flow, one small detail can make a big difference the unit of measurement. If the system assumes the wrong unit, it can lead to incorrect calculations and confusion in reports. Now, that clarity is built into the system.
What’s updated
You can now select the flow rate unit while configuring the flow meter.
Choose between:
- Litres per hour (L/h)
- Cubic metres per hour (m³/h)
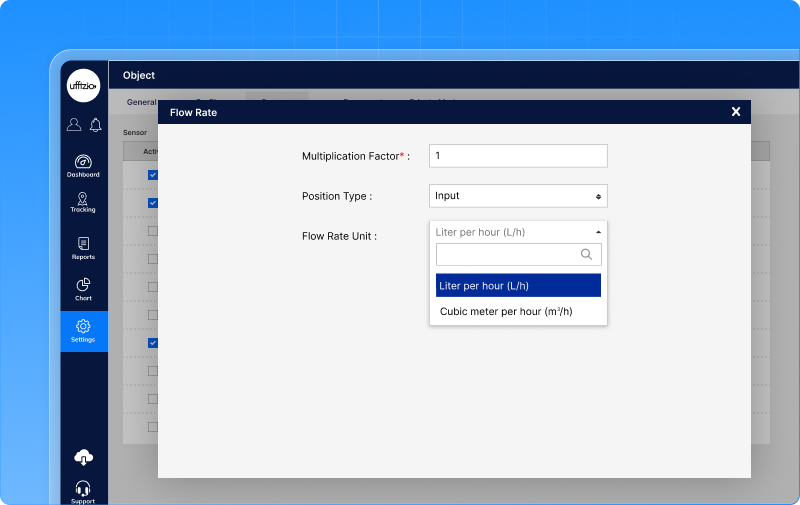
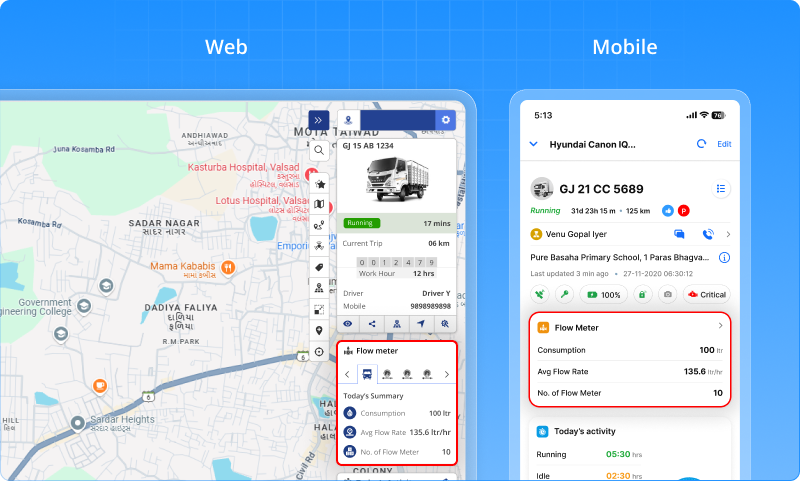
Once selected, the system uses this unit consistently across:
- Live Tracking (Web & Mobile)
- Flow meter widgets
- Reports and downloads
Why this matters
- Prevents incorrect fuel calculations
- Removes confusion in reports and live tracking
- Ensures the system always reflects the sensor’s actual data
Now, your flow data is not just visible it’s accurate, clear, and easy to trust
1.11 Group-Based vehicle view in live tracking
When managing many vehicles, a simple list is not always enough. Sometimes, you want to see vehicles based on how they are grouped like by operation, region, or type. Earlier, even if groups were created, vehicles still appeared in a flat list. This made it harder to quickly understand and analyze them. Now, you can switch the view as per your need.
What’s changed
In Live Tracking, you now have an additional view:
- Standard View → Company → Branch → Vehicle
- Group View → Company → Vehicle Group → Vehicle
This helps you see vehicles based on how they are logically grouped.
When this applies
This view is available only when:
- You are a Company user or sub-user
- Each vehicle belongs to only one group
![]()
If these conditions are not met, the system will continue showing the standard view.
Why this matters
- Better organization of vehicles
- Easier tracking based on groups
- Cleaner and more meaningful view
Now, instead of just a list you can see vehicles grouped in a way that makes more sense.
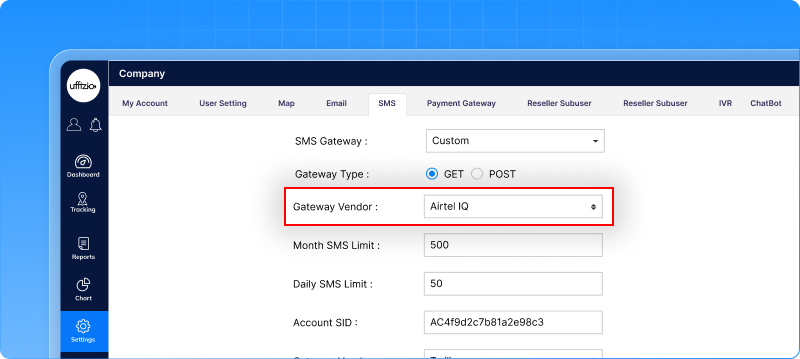
1.12 Send system SMS using Airtel IQ
Many businesses already use Airtel IQ for sending SMS. Now, Trakzee connects directly with it.
What’s updated
You can now integrate Airtel IQ SMS API with the system. This means all system messages can be sent through your existing Airtel IQ account.
For example:
- Alerts
- OTPs
- Reports
Once configured, SMS will be sent using Airtel IQ automatically.
Why this matters
- Use your existing SMS provider
- Better control over SMS delivery
- No need for separate setup
Now, your system notifications can flow through the platform you already trust.
1.13 A cleaner and smarter reports & settings experience
As features grow, finding the right option can become difficult. Reports get longer, settings get crowded and users spend more time searching than working. Now, everything is better organized.
What’s changed
Both Reports and Settings have been redesigned to make navigation simpler and faster.
Reports- Easier to find what you need
- Reports and Charts are now in separate tabs
- A search option helps you quickly find reports
- Reports are grouped into sections like:
- Activity (Trips, Stoppage, Idle, etc.)
- Performance (Work hours, utilization, distance, etc.)
- Clear icons and colors make scanning easier
Settings- More organized and clear
- A profile section shows account details at the top
- All key modules are grouped under management
- Quick access options like parking and help desk are easily available
- A fixed bottom menu helps you move between screens anytime
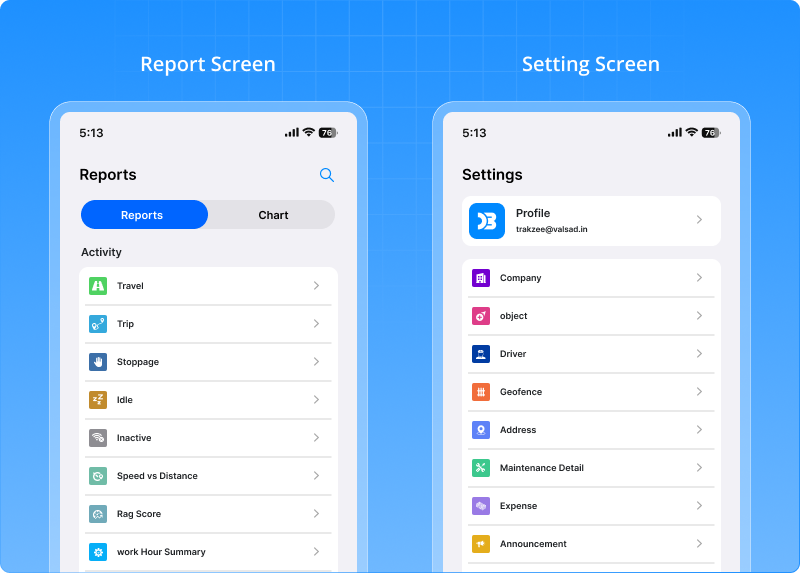
Available on both Android & iOS
The same improved experience is now available on both platforms, with a consistent layout and navigation.
Why this matters
- Faster navigation across features
- Less clutter, more clarity
- Easier to find reports and settings
- Better overall user experience
Now, instead of searching for options you can find everything exactly where you expect it.
1.14 Correct job status even with delayed data
Sometimes, vehicles complete their job on time, but the data reaches the system late. Due to this delay, those visits were earlier marked as missed, even though the work was actually done. This created confusion during audits and reports. Now, the system fixes this automatically.
What’s updated
The system now checks for delayed data in the background. If it finds that a vehicle actually completed a visit, the status is automatically updated from Missed to Visited. This happens even if the data comes late.
Why this matters
- More accurate job reports
- No false “missed” records
- Better trust in system data
- Clear and correct audit history
Now, even if data arrives late, your job records stay true to what actually happened.
1.15 AI insights that adapt to every report
Every report answers a different question.
- Trip Report → How efficiently are trips running?
- Travel History → How is the vehicle moving during the day?
So, showing the same type of insight everywhere doesn’t work. Now, AI understands this difference.
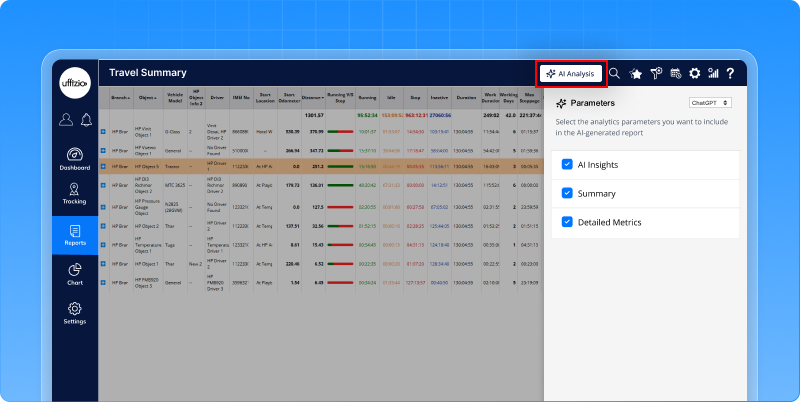
What’s changed
AI Insights are now available across multiple reports and each report comes with its own context-based analysis. Instead of giving generic summaries, AI focuses on what matters most in that specific report.
Trip report — Focus on efficiency & utilization
AI analyzes how effectively trips are being performed.
It highlights:
- High idle vs running time
- Uneven trip distribution across vehicles
- Excessive stoppages and delays
- Driving behavior issues like overspeeding
It also suggests improvements like:
- Reducing idle time
- Balancing workload
- Improving driving behavior
Helps improve trip efficiency and overall fleet performance
Travel history report — Focus on movement patterns
AI analyzes how vehicles move throughout the day.
It highlights:
- Frequent stops and long idle gaps
- Short or fragmented movements
- Underutilization between trips
- Irregular speed patterns
It also helps identify:
- Time loss between movements
- Opportunities to optimize routes
Helps improve route flow and daily vehicle utilization
Speed vs Distance report — Focus on driving behaviour & speed distribution
The Speed vs Distance AI Insights are designed to analyze how vehicles are driven across different speed ranges. Instead of just showing distance distribution, AI highlights:
- Which speed ranges dominate fleet movement
- Uneven usage across vehicles at different speeds
- Underutilized or inactive vehicles
- Workload concentration on specific vehicles
It also identifies:
- Imbalance in fleet usage based on speed behavior
- Potential risks like driver fatigue or overuse of certain vehicles
And goes further by suggesting:
- Balancing workload across vehicles
- Monitoring high-usage vehicles for maintenance
- Improving fleet deployment strategies
Why this matters
- No need to manually analyze reports
- Focus only on what matters in each context
- Faster and smarter decision-making
- Each report becomes actionable
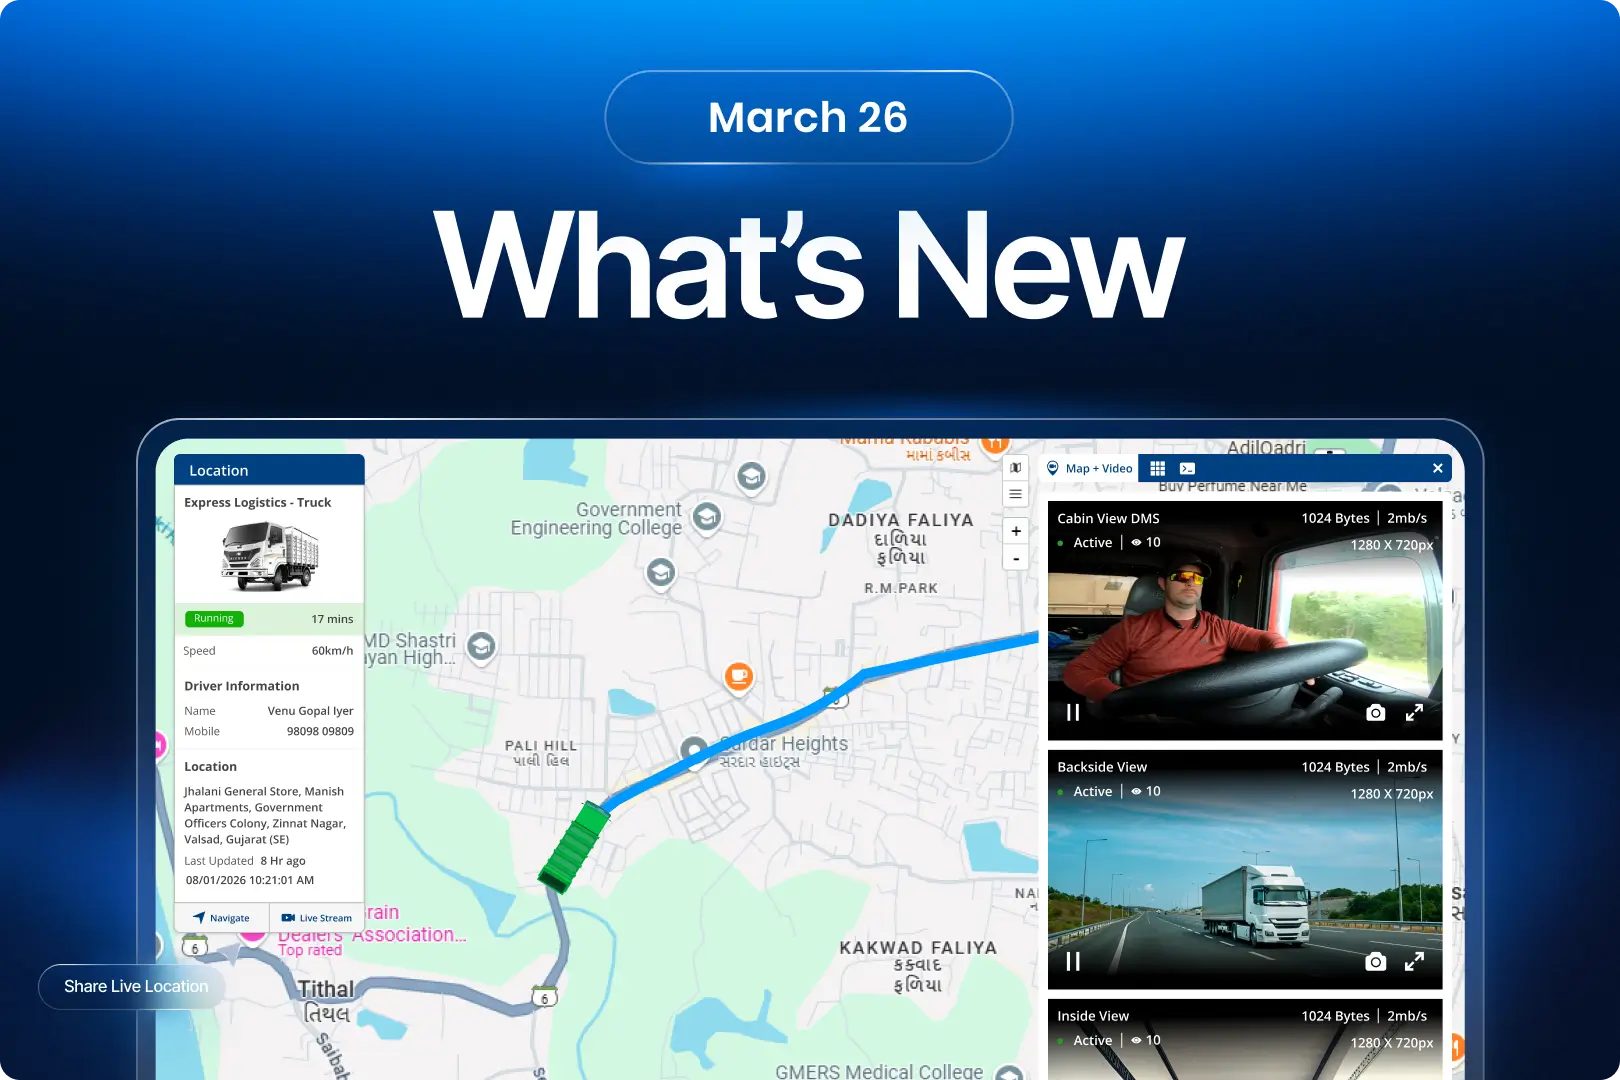
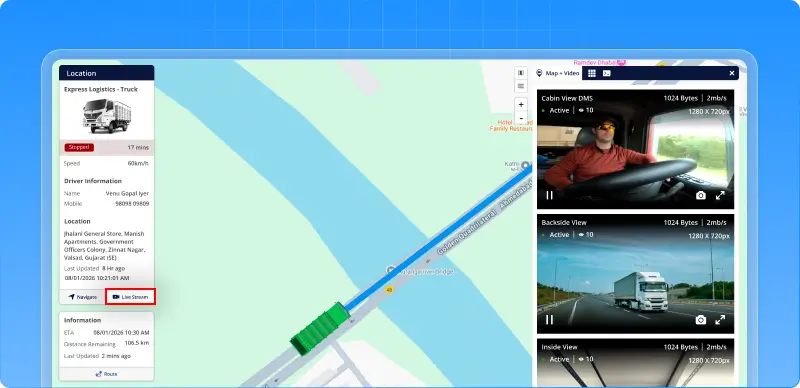
1.16 Share Live Location with Video Streaming
Sometimes, just sharing location is not enough. You know where the vehicle is but you still want to know what’s happening there. Now, you can see both.
What’s changed
You can now share a single link that shows:
- Live vehicle location
- Live camera streaming
All in one place and no login is required. Anyone with the link can view both map and video instantly.
What this makes possible
- Easy access: View live video and location without logging into the system
- Faster response: Understand situations in real time and act quickly
- Better coordination: Share the link with teams or clients for instant visibility
- More transparency: Let stakeholders see what’s happening without platform access
Why this matters
- Improves monitoring in critical situations
- Enhances customer confidence
- Reduces dependency on system access
Now, instead of just sharing location you can share the complete live view.
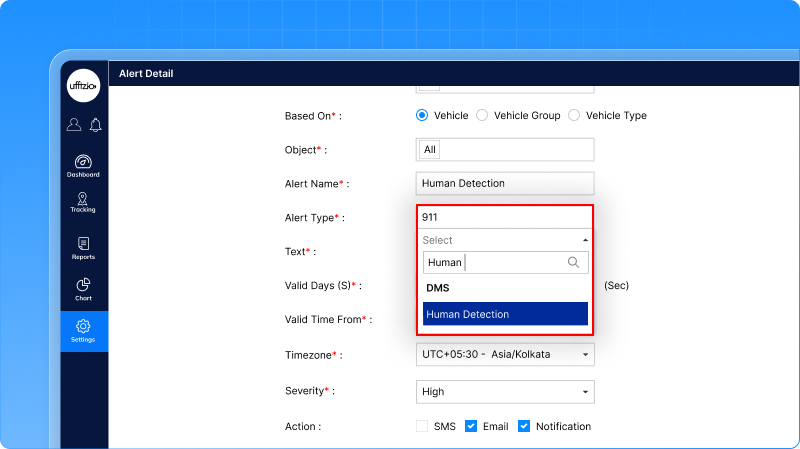
1.17 Get instant alerts when human presence is detected under restricted zone
Sometimes, what matters most is not just the vehicle but what’s happening around it. Earlier, even if the device detected human presence, there was no clear way to get alerts for it in the system. Now, you can.
What’s updated
New alerts are added for Human Detection (DMS). When the device detects human presence:
- An alert is generated instantly
- You can receive it via SMS, Email, or Notification
Each alert can also include a video link, so you can see what actually happened.
What This Means for You
- Get notified when human activity is detected
- See the actual situation through video
- Take action quickly when needed
Why This Matters
- Improves safety and monitoring
- Faster response to critical situations
- Less dependency on manual tracking
- Better visibility of on-ground events
Now, you don’t just track vehicles you also stay aware of what’s happening around them.
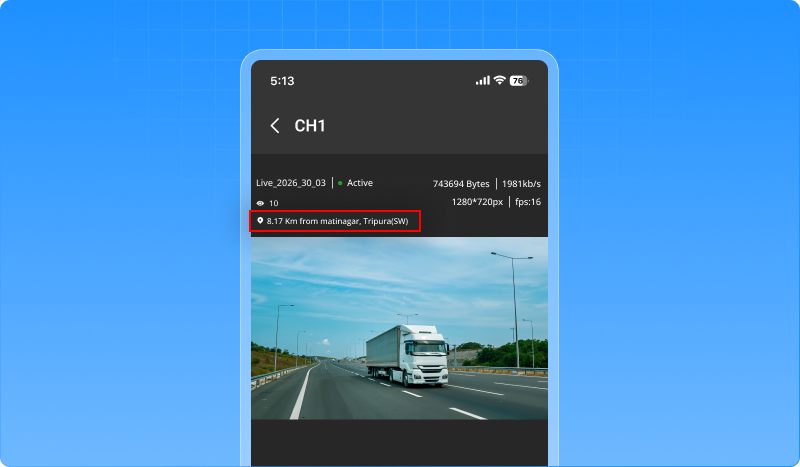
1.18 See Location While Watching Live Video on Mobile
When watching live video, knowing the location is just as important. Earlier, this was possible only on the web. On mobile, you could see the video but not the location. Now, both are available together.
What’s changed
While watching live video on mobile, you can now also see the vehicle’s location. This means:
- Watch the live stream
- See exactly where it is happening
All in one place.
Why This Matters
- Better visibility while on the move
- No need to switch to web for location
- Faster understanding of situations
- Improved monitoring from mobile devices
2. Smartwaste Updates
2.1 A clearer view of vehicle deployment
Managing deployment is not just about knowing how many vehicles are active. It’s about understanding where they are and how they are performing. Earlier, this visibility was limited. Now, it’s much clearer.
What’s changed
The deployment status widget has been redesigned to give you a more structured and meaningful view. You can now:
- View deployment at zone or ward level
- Switch between views using a simple dropdown
- See how vehicles are distributed in each area
What you can understand instantly
For each Zone or Ward, you can now see:
- Total deployed vehicles
- Vehicles ready to operate
- Vehicles in breakdown or repair
- Vehicles involved in accidents
This gives you a quick picture of ground-level operations.
![]()
What makes it better
- Clear area-wise deployment visibility
- No need to open multiple reports
- Accurate data based only on actual deployment
- Undeployed vehicles are not mixed into area data
Why this matters
- Better planning at Zone and Ward level
- Faster operational decisions
- Reliable data for reviews and reporting
Now, instead of just seeing numbers you can understand deployment exactly where it matters.
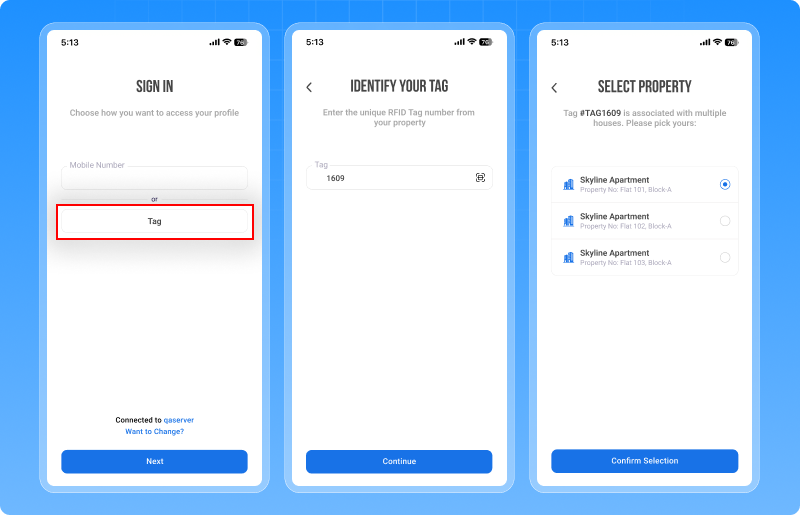
2.2 Easy citizen login with tag number
Many citizens faced one simple issue: They had the app… but couldn’t log in. Why? Because their mobile number was not linked to their property. Now, that barrier is removed.
What’s updated
Citizens can now log in using their tag number (RFID). No need to depend only on pre-registered mobile numbers. They get two simple options:
- Login using Tag Number
- Login using Mobile Number (existing way)
How it works
If using Tag Number:
- Enter the Tag Number
- If a mobile number is already linked → OTP is sent
- If not → user can add their mobile number and continue
- OTP verification completes the login
If using Mobile Number:
- Works as usual with OTP
What this solves
- No more login failures due to missing mobile numbers
- Citizens can easily access the app
- Mobile number gets linked during login itself
Why this matters
- Smooth and hassle-free login experience
- Faster onboarding for new users
- Better and accurate data over time
- No impact on existing users
Now, citizens don’t get stuck at login they can access the system easily, anytime.
2.3 Multiple vehicle reassignment for upcoming routes
Planning routes is one thing but real operations rarely go exactly as planned. Vehicles may go to the workshop, get reassigned, or become unavailable at the last minute. Now, you can handle this easily.
What’s updated
You can now reassign vehicles multiple times for routes that are still in the upcoming stage. No restrictions. No delays.
What this solves
- If a vehicle goes to the workshop → quickly assign another
- If plans change → update instantly
- If there’s a sudden situation → adjust without disruption
Why this matters
- Saves hours of manual effort in large operations
- Keeps services running smoothly during unexpected changes
- Reduces dependency on backend support
- Helps maintain service timelines and commitments
Now, even if plans change your operations stay on track without interruption.
2.4 Quick checkpoint selection with smart search
When dealing with hundreds or even thousands of checkpoints, finding the right one on the map can take time. Now, you don’t have to search manually anymore.
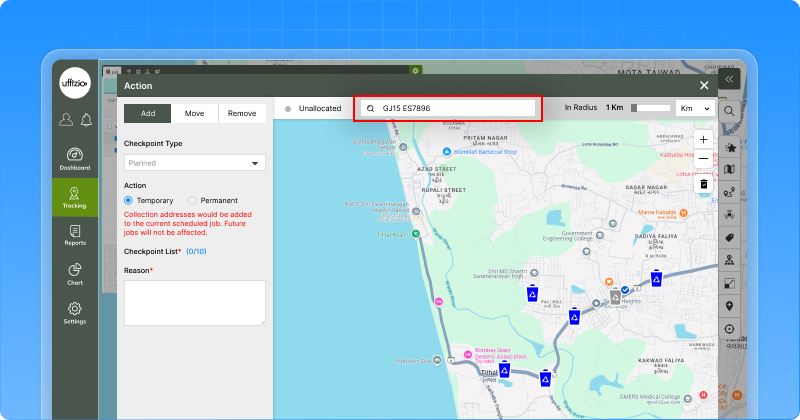
What’s updated
The Action button now supports search-based checkpoint selection. You can simply:
- Search by checkpoint name or address
- Select the exact location from the list
No need to rely only on map clicks.
Why this matters
- Saves time for teams managing large city operations
- Reduces errors by selecting the exact checkpoint
- Makes daily planning faster and easier
Now, instead of searching on the map you can find checkpoints instantly with a simple search.
2.5 Comment on alerts instantly from notifications
When an alert comes in, action should be quick. But earlier, even to add a simple comment, you had to move across multiple screens. Now, everything happens in one place.
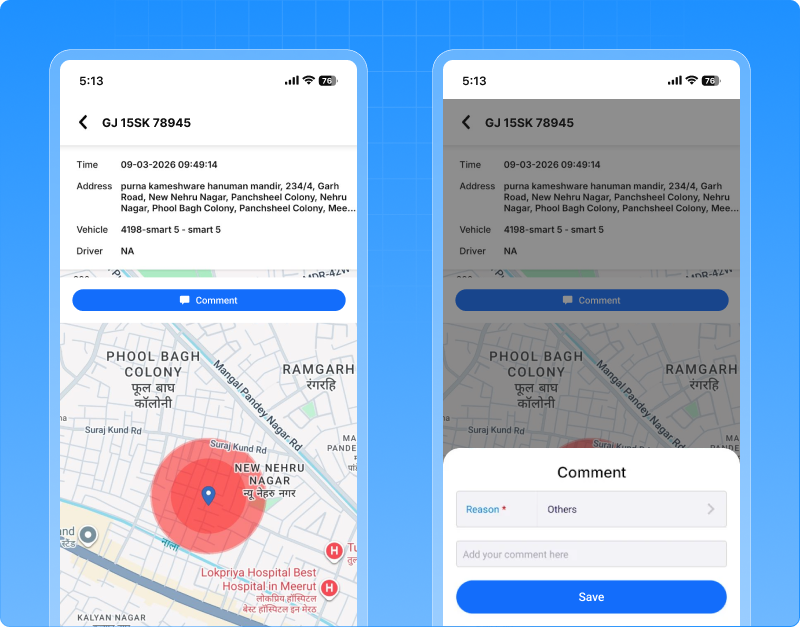
What’s changed
You can now open alerts directly from notifications and add or view comments instantly. No need to search or navigate.
What this enables
- Take action on alerts the moment they arrive
- Discuss issues like missed collection or delays directly in the alert
- Keep all communication in one place
Why this matters
- Faster response to important alerts
- Better coordination between teams
- Complete comment history for audits and reviews
- No need to depend on calls or WhatsApp
Now, alerts are not just notifications they become a space for action and collaboration.
2.6 Handle field challenges with smart job closure
In real waste collection operations, things don’t always go as planned. A job may remain incomplete due to situations like:
- A vehicle breaking down midway
- Roads getting blocked due to construction or local issues
- Entry restrictions in societies or commercial areas
In all such cases, the work stops but the system continues to show the job as “In Progress.” This creates confusion:
- Supervisors think the job is still running
- Dashboards show incorrect status
- Reports do not reflect the actual situation
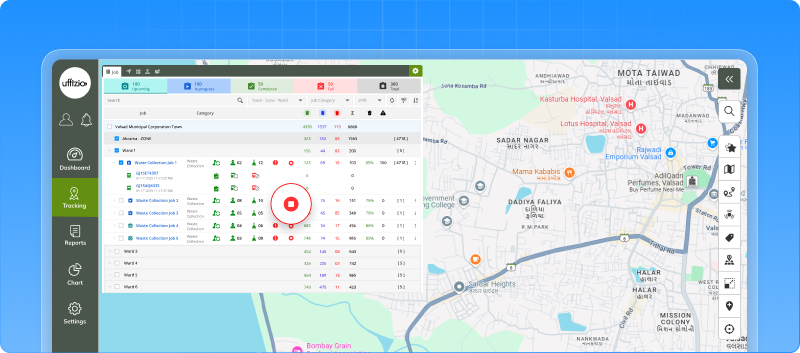
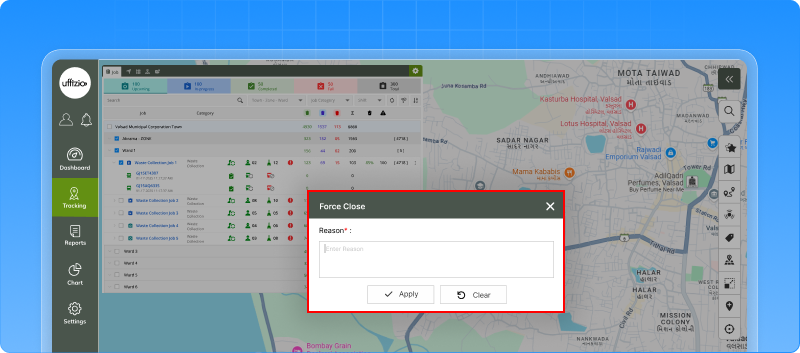
What this enhancement solves
The Force Close option allows managers to step in and close such jobs with a valid reason.
When used:
- The job is marked as Completed with Error
- Remaining checkpoints are marked as Missed
- The system reflects the real ground situation
Why this matters
- Keeps system data aligned with real operations
- Prevents jobs from staying open unnecessarily
- Ensures accurate dashboards and reporting
- Helps teams take quicker next actions
Now, even when operations face unexpected challenges your system stays clear, reliable, and in control.
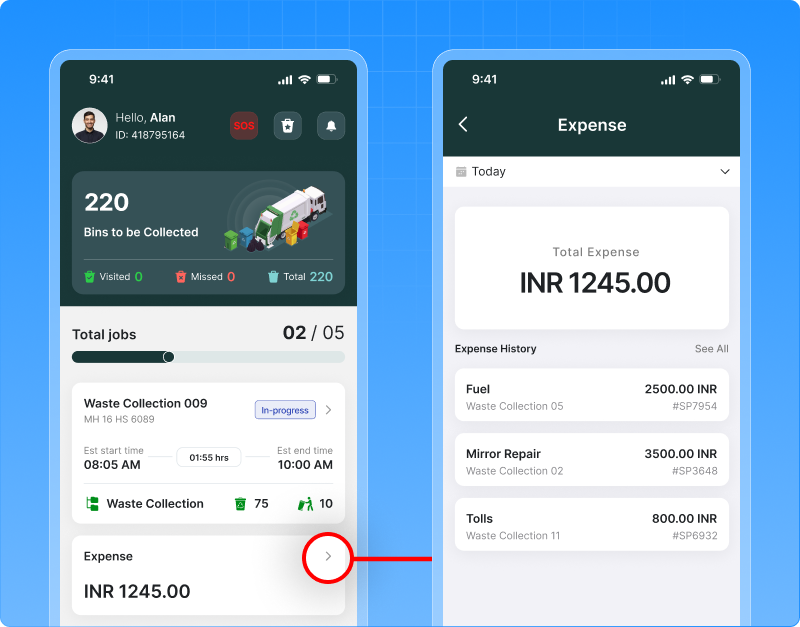
2.7 Capture field expenses directly from the collector app
In daily operations, expenses happen on the ground like fuel, small repairs, tolls, or other costs but these are often noted later or shared manually. This leads to:
- Missed entries
- Delays in reporting
- Lack of clear expense tracking
Now, expenses can be captured instantly.
What’s updated
The Expense module is now available in the Collector App. Collectors can:
- Add expenses directly during their job
- Select expense type and enter details
- Submit it instantly into the system
All data gets synced with the web automatically.
What this enables
- Expenses are recorded at the source
- Linked with job, vehicle, and route
- Visible and editable from the web
No more manual tracking or follow-ups.
Why this matters
- Reduces paperwork and manual errors
- Gives clear visibility of operational costs
- Helps in better budgeting and analysis
- Ensures transparency for audits and reporting
Now, expenses are not tracked later they are captured instantly, where they happen.
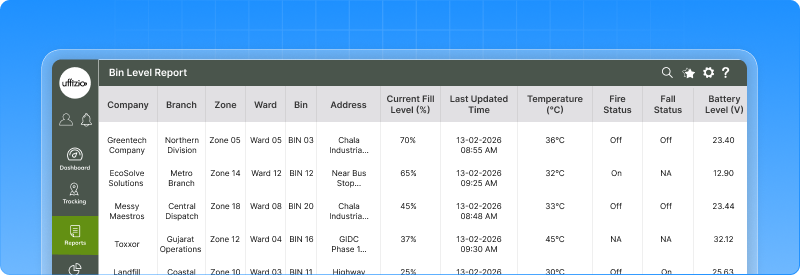
2.8 Know which bins need attention with bin level status report
In waste management, timing is everything. If bins overflow, it affects cleanliness. If bins are collected too early, it wastes resources. Earlier, there was no single place to see which bins actually need attention. Now, you get a complete view.
What’s changed
A new Bin Level Status Report gives you a clear view of all smart bins in one place. You can instantly see:
- Which bins are full or near full
- Which bins are underutilized
- When each bin was last updated
What you can monitor
Along with fill levels, you also get:
- Battery status
- Temperature and fire alerts
- Bin fall status
- Last update time
So you don’t just track fill, you also track bin health.
What this enables
- Identify bins that need immediate collection
- Plan routes based on actual bin status
- Avoid unnecessary pickups
- Improve overall service efficiency
Why this matters
- Better decision-making with real data
- Improved city cleanliness and service quality
- Strong support for smart city operations
- More efficient use of vehicles and resources
Now, instead of guessing which bins to collect, you can act based on real-time data.
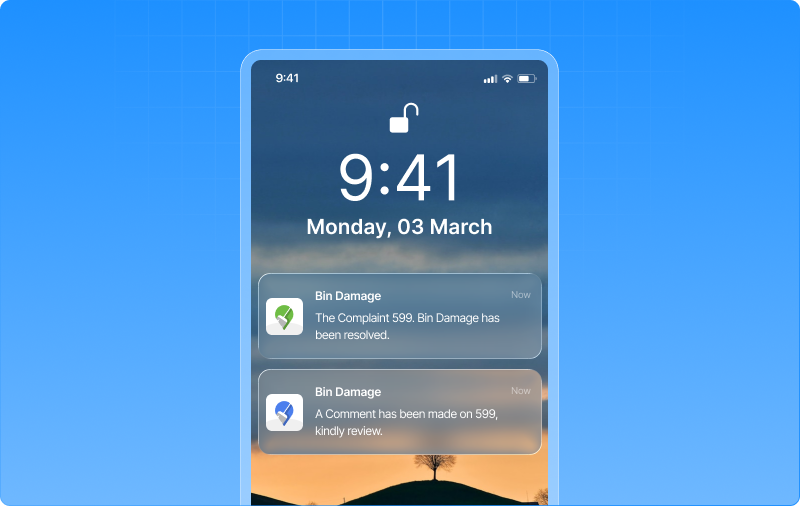
2.9 Stay updated on complaints without checking again and again with notifications
When a citizen raises a complaint, timely action is important. But earlier, there was a gap:
- Managers didn’t know when a complaint was raised
- Citizens had to keep opening the app to check updates
- No alerts for comments or resolution
This led to delays and missed communication. Now, everything is automatic.
What’s changed
The system now sends real-time notifications for key complaint updates. What You’ll Be Notified About
For Managers
- When a new complaint is raised
→ So action can be taken immediately
For Citizens
- When a comment is added
→ So they stay informed - When the complaint is resolved
→ No need to check manually
Each notification takes you directly to the relevant screen.
What this solves
- No more repeated app checking
- No missed complaints or updates
- Faster response from management
Why this matters
- Improves communication between citizens and teams
- Speeds up complaint resolution
- Enhances overall service experience
- Builds trust through timely updates
Now, instead of chasing updates everyone stays informed automatically, at the right time.
2.10 Clear Feedback for Duplicate Tag Errors During Sync
Surveyors often work in offline mode. They add data in the field and sync it later. But sometimes, a duplicate tag gets added unknowingly. Earlier, when this happened:
- The record failed during sync
- It showed as unsynced
- But no clear reason was visible
This created confusion and delays.
What’s updated
Now, when a duplicate tag causes a sync failure, the system shows a clear message:
“Sync Failed – Duplicate Tag”
So the user knows exactly what went wrong.
![]()
What this solves
- No more guessing why a record failed
- Immediate clarity on duplicate entries
- Easier correction and re-sync
Why this matters
- Prevents duplicate or incorrect survey data
- Improves accuracy of RFID-based records
- Reduces dependency on support teams
- Ensures reliable data for audits and reporting
Now, instead of confusion users get clear answers and clean data.
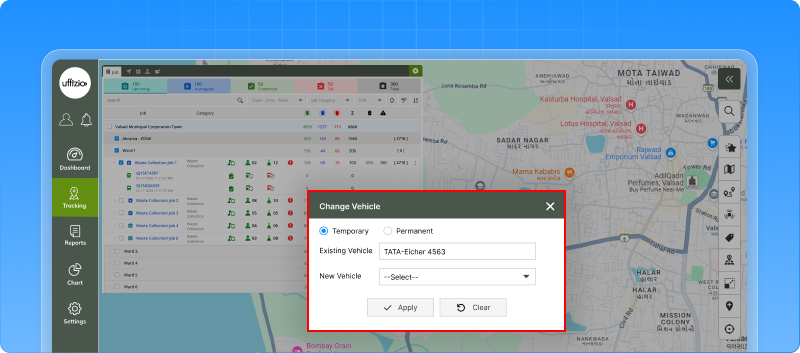
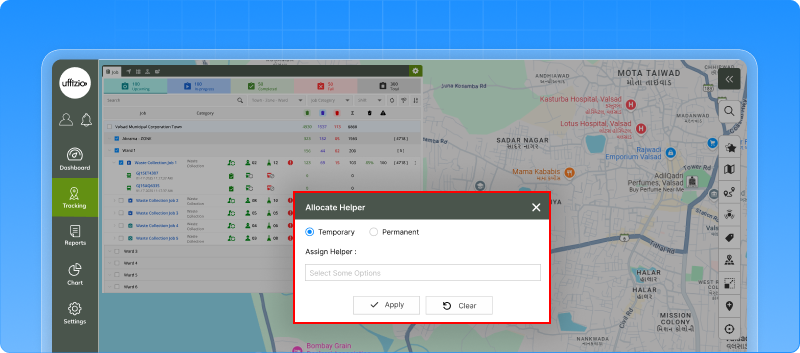
2.11 Manage helper allocation with more flexibility
In waste collection, it’s not just about vehicles it’s also about the people on ground. Helpers play a key role in every job. Earlier, helpers could be assigned, but there was no clarity on how they were assigned. Now, that flexibility is added.
What’s updated
You can now assign helpers as:
- Temporary
- Permanent
This gives better control over how manpower is allocated for each job.
What this improves
- Clear visibility of helper deployment
- Better tracking of manpower across jobs
- More structured allocation, similar to collectors
Smart control with validations
To avoid confusion and errors:
- Helpers can be updated only in Upcoming or In-Progress jobs
- Once attendance is marked, helpers cannot be removed
- The system ensures all changes are valid and consistent
Why this matters
- Better planning of workforce along with vehicles
- Useful for contracts where manpower tracking is important
- Helps monitor attendance and productivity
- Supports complete operational visibility
Now, you don’t just manage vehicles you manage your entire field team, the right way
2.12 See assigned jobs directly at each collection address
When managing multiple jobs and collection points, one common question comes up:
“Is this address already assigned to a job or not?”
Earlier, to find this, you had to:
- Open job modules
- Check mappings
- Go back and verify
It took time and could still lead to confusion. Now, you can see it instantly.
What’s changed
The Collection Address screen now shows assigned jobs directly. A new column displays:
- How many jobs are linked to each address
- Click to see full job details
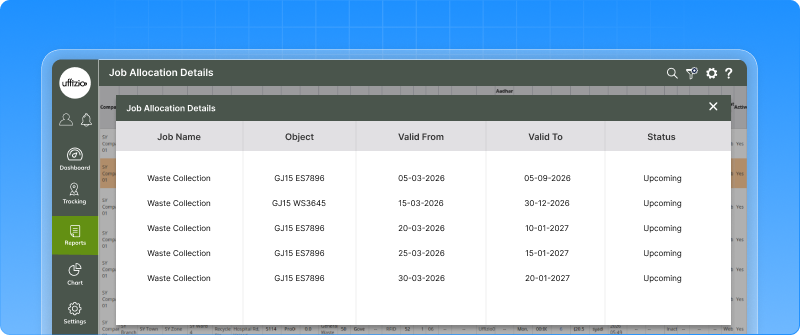
What you can do now
- Instantly know if an address is already assigned
- View job details like:
- Job name
- Vehicle assigned
- Valid dates
- Status
All without leaving the screen.
What this solves
- No more checking multiple screens
- No duplicate or missed assignments
- Clear visibility of workload per address
Why this matters
- Better planning for high-density areas
- Helps balance workload across jobs
- Supports SLA tracking and audits
- Improves decision-making during live operations
Now, instead of guessing or double-checking you can see job allocation clearly at every collection point.
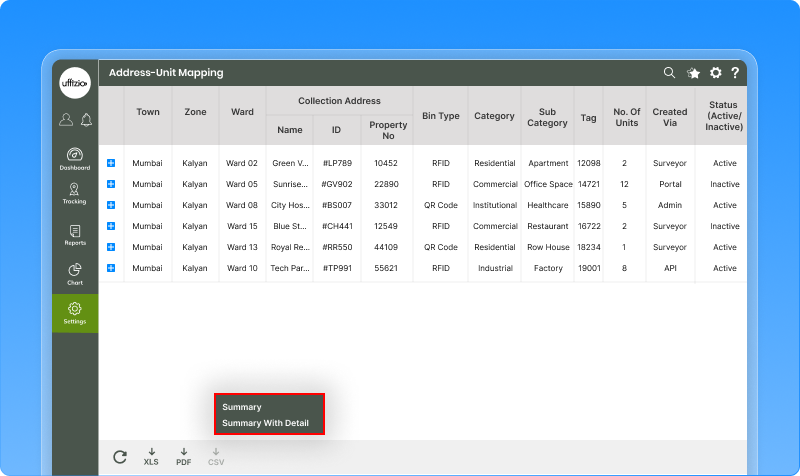
2.13 Get summary and detailed data in one report
When working with reports, users often need both:
- A quick summary view
- And a detailed breakdown
Earlier, this meant:
- Downloading two separate reports
- Manually combining them
It was time-consuming and repetitive. Now, it’s much simpler.
What’s changed
A new “Summary + Detail” export option is added in the Address–Unit Mapping report. With one click, you get:
- Summary data
- Detailed data
All in a single report.
What this solves
- No need to download multiple files
- No manual merging of data
- Everything available in one place
Why this matters
- Saves time and effort
- Gives a complete view instantly
- Makes reporting more efficient
- Useful for analysis, sharing, and audits
Now, instead of handling multiple reports you get a complete picture in just one download.
Conclusion
With these updates, the platform continues to evolve from a tracking system into a complete operational intelligence solution. By combining automation, clarity, and AI-driven insights, it enables faster decisions, better control, and more efficient operations across the board.