Fuel is one of the highest costs in any fleet operation. Yet for most fleet managers, understanding fuel performance means jumping between reports. Fills in one place. Drains in another. Trip data somewhere else. Consumption figures are on a different screen.
The data exists. Putting it together is the problem.
The Problem with Fragmented Fuel Reports
Fleet fuel management is not just about tracking how much fuel goes in.
It is about understanding the full picture. How much fuel was consumed on each trip? Were there any unusual drains? Does consumption match mileage? Who was driving when fuel activity spiked?
When answers to these questions sit across multiple reports, fleet managers spend more time collecting data than analysing it. They miss patterns. They catch problems late. And when something suspicious happens, like a fuel drain that does not match a trip, connecting the dots takes manual effort and time.
That is a daily frustration for fleet operations teams. And it is a gap that makes fuel monitoring feel reactive instead of proactive.
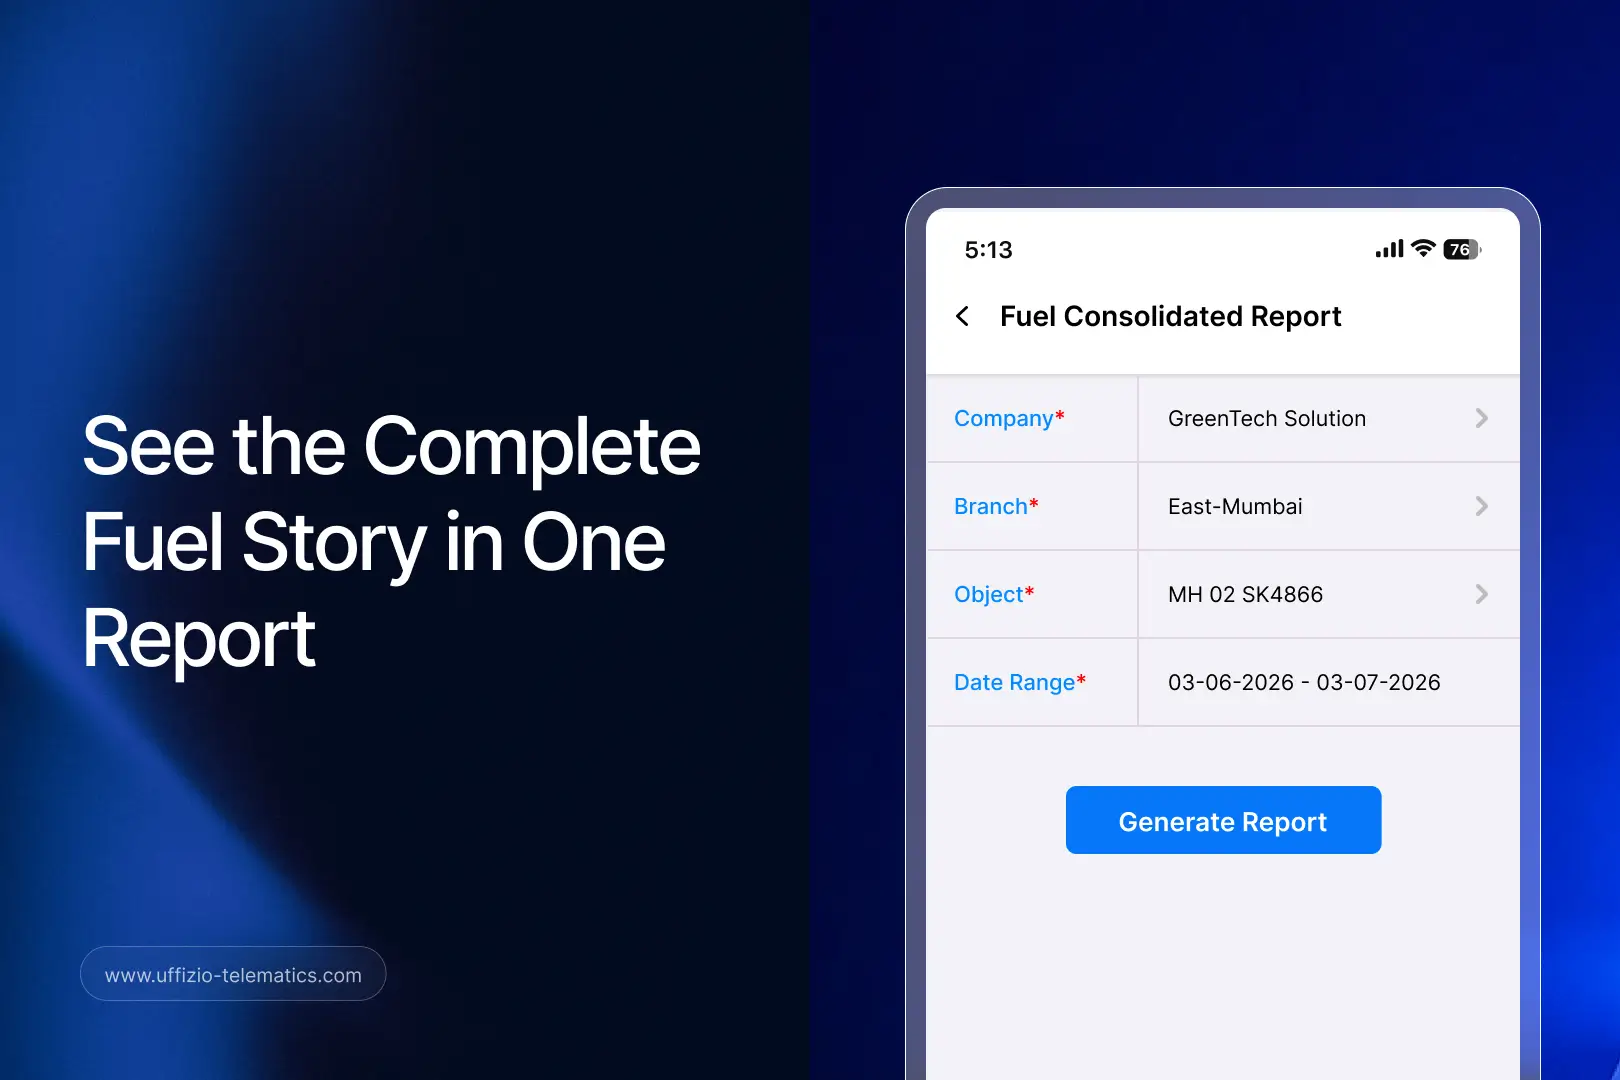
What the Consolidated Fuel Report Includes
Trakzee now brings all critical fuel data into a single, downloadable report.
Using simple filters, company, branch, vehicle, and date range, fleet managers can generate one report that includes:
- Fuel fill events — every instance where fuel was added to a vehicle
- Fuel drain events — unexpected or recorded drops in fuel levels
- Trip details — journey records tied directly to fuel activity
- Mileage — distance covered per trip and per vehicle
- Fuel consumption — how much fuel was used across trips
- Speed metrics — driving behaviour data linked to fuel usage
- Driver information — who was operating the vehicle during each event
- Fuel charts — visual summaries of fuel trends over the selected period
- Summary statistics — key numbers at a glance for quick review
The report is available on both the web and mobile. It downloads as a PDF, ready to share in reviews, audits, or client meetings.
Everything is in one place. Nothing needs to be cross-referenced manually.
What Changes When Everything Is in One Place
The shift sounds simple. But the impact is significant.
When fuel fills, drains, trips, and consumption are visible together, patterns become obvious that were previously hidden.
A fuel drain that coincides with a parked vehicle and no trip activity stands out immediately. It is a red flag for potential fuel theft and it is easy to miss when data is spread across separate reports.
Consumption that seems high on a particular route becomes explainable when you can see the speed data alongside it. High speeds mean higher consumption. The consolidated view makes that connection instant.
A driver with consistently high fuel usage becomes visible when driver information sits next to consumption figures in the same report. That opens the door to coaching conversations backed by data, not guesswork.
In short, the consolidated fuel report does not just save time. It surfaces insights that fragmented reports hide.
Why This Matters for System Integrators
Fuel management is a top priority for your clients, especially in trucking, logistics, construction, and any operation running large or heavy vehicles.
When you pitch a fleet management solution, fuel visibility is almost always on the checklist. Clients want to know: can your platform help us reduce fuel costs? Can it detect theft? Can it show us where fuel is being wasted?
The consolidated fuel report gives you a concrete, demonstrable answer to all three questions.
Here is what it means for your business:
Stronger pitch for fuel-heavy clients. Trucking and logistics clients deal with fuel as a major operational cost. A single report that covers fills, drains, consumption, and trips is a compelling capability to show in a demo.
Faster client onboarding. The report is filter-based and simple to generate. Clients do not need training to use it. That reduces your support burden after deployment.
Audit-ready reporting. The downloadable PDF format means clients can share fuel performance data in operational reviews and stakeholder meetings without any extra preparation.
A clear answer to the fuel theft question. Fuel drain events visible alongside trip data make theft investigation straightforward. That is a feature clients in high-risk regions ask for specifically.
Mobile accessibility. The report is available on mobile. Fleet managers in the field can access fuel data without needing to be at a desk. That matters for clients running distributed operations.
Fuel Intelligence Your Clients Can Actually Use
Most fleet platforms collect fuel data. Not all of them make it easy to understand.
The difference between raw data and fuel intelligence is context. Fills mean more when you can see the trips that followed. Drains mean more when you can see whether a vehicle was moving or parked. Consumption means more when you can see who was driving and how fast.
Trakzee’s consolidated fuel report delivers that context in one place. No switching between screens. No manual calculations. No piecing together a picture from separate sources.
The Full Fuel Story, Finally in One Place
Fuel costs do not get easier to manage when data is scattered. They get harder.
Your clients need visibility that is fast, complete, and actionable. The consolidated fuel report delivers exactly that one report, every data point, ready to use.
That is the kind of capability that makes a fleet management solution worth renewing.