1. Trakzee Updates
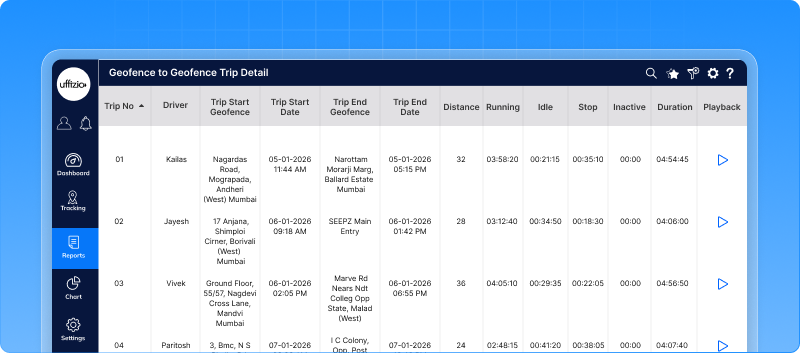
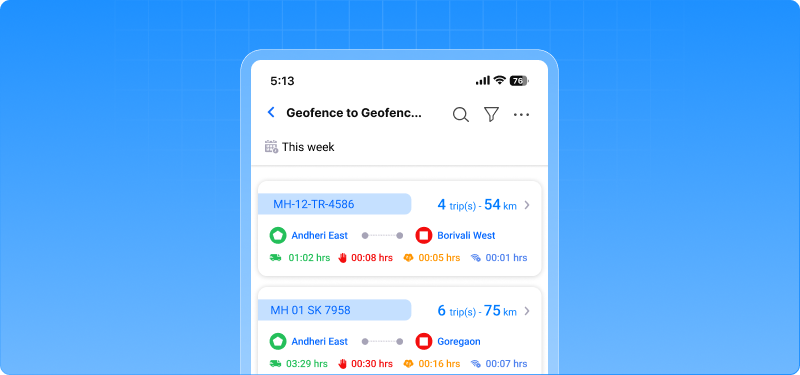
1.1 New Driver Information column added to geofence to geofence trip summary
The geofence to geofence trip summary shows trip details from when the trip starts to end within geofence marked uptill now. Fixing this gap, a new ‘Driver Information’ column has been added to summary and detail reports on both web and mobile.
The new column appears after vehicle information, it shows driver names indicating how many drivers were assigned during the selected trip for that period of time. This helps fleet managers track movement of trips within geofence locations.
1.2 Fuel drain reports now detects unauthorised fuel losses
Managing unauthorized fuel losses just became flexible. Earlier, it showed fuel drop with drain tolerance limit. The new enhancement enables accurate detection of slow fuel theft during vehicle stop (vehicle ignition off) by introducing stop-mode micro drain detection. Now fleet managers can view actionable insight regarding theft prevention through separate event tracking and chart visualisation.
![]()
![]()
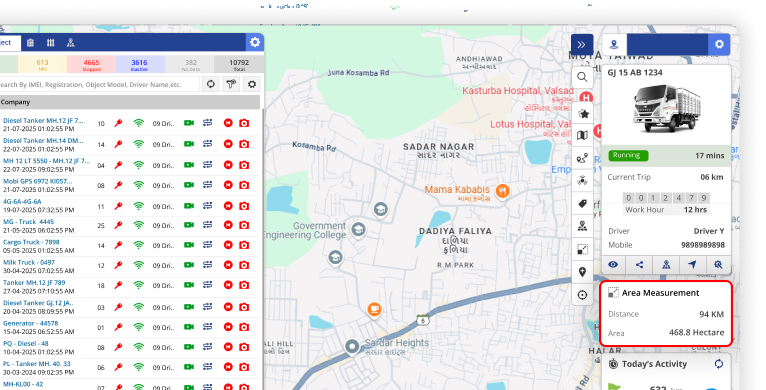
1.3 Area measurement widget added inside live tracking tooltip
Area measurement unit is available inside the area measurement report. To improve accessibility for users, we’ve added a new area measurement widget inside the live tracking tooltip. This widget shows how much area was covered by the vehicle on that day, along with distance area coverage information is also shown same as the report. It displays area value in acre and hectare. This widget has an enable/disable option for both mobile and web.
![]()
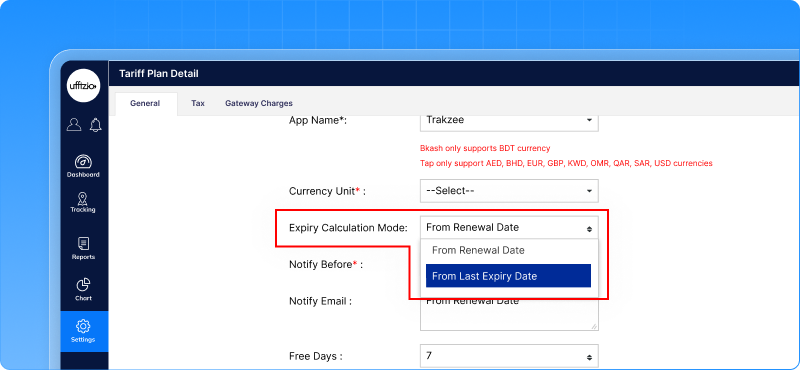
1.4 Tariff plans can be calculated based on expiry or renewal date
A new configuration option has been added to the prepaid tariff plan that controls how the new expiry date will be calculated when a client renews after expiry date.
Previously, the system used to calculate the next expiry date from the renewal entry date which led to mismatch in billing cycle and renewals often got delayed causing revenue loss.
What changed
We introduced a new expiry calculation mode, is now available in the tariff plan. The clients can choose between:
From the last expiry date – the plan continues from the previous date, regardless of renewal delay.
From the renewal date – calculates expiry from the actual renewal date. (default option)
Why this matter
- The billing cycle remains consistent and prevents revenue loss.
- Ensure duration alignment and license utilization.
1.5 New screen created to transfer multiple vehicle transfer across web
First, single vehicle transfer was available in the screen which used to check if the old company plan must not have a tariff plan before allowing transfer.
But now we have a feature that allows users to transfer bulk vehicles from one Company/Branch to another. The same tariff plan will be used in single and multiple vehicle transfer.
![]()
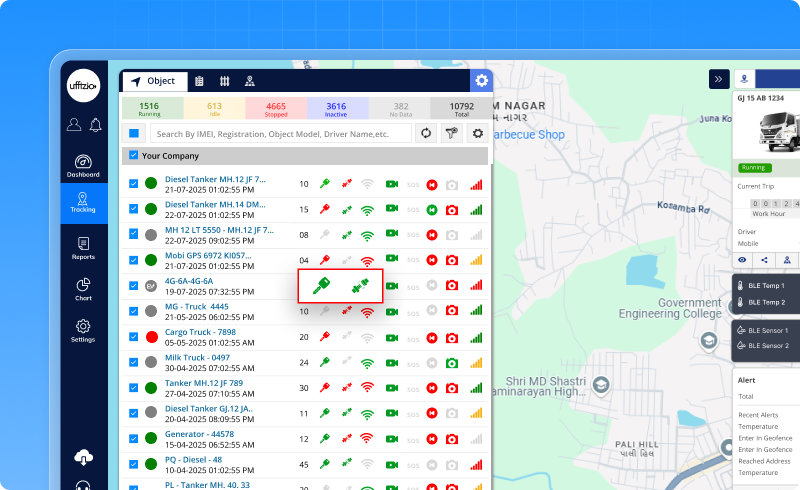
1.6 Now you can change the order of icon in object list
Earlier, the icons were displayed in fixed horizontal order. The object list now adapts to how the information must be displayed on their screen. Users can now rearrange the icons sequence in the object list that matters most to their daily operations. The selection is saved and appears in the same sequence every time the object list is accessed. This change improves visibility for data and efficient user experience.
![]()
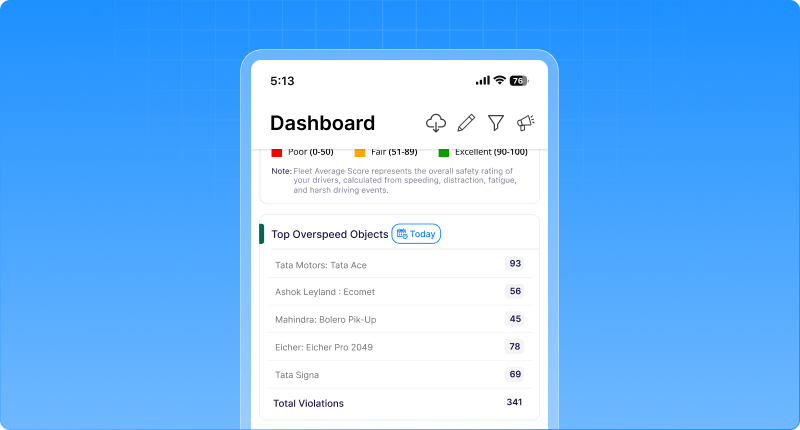
1.7 Top 5 overspeeding violation widget is now visible on dashboard at company level.
A new widget ‘ Top 5 overspeeding violation vehicle’ is now added to the screen in the dashboard at company level. This widget displays vehicle id and count of overspeeding violation. You can select the filter from the right-hand side which offers multiple date range options. It helps fleet managers to take initiative towards the drivers assigned to particular fleets during the trip.
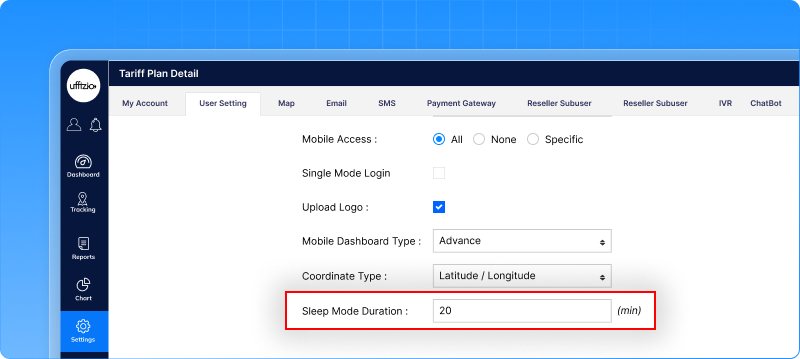
1.8 Sleep mode duration is now available at reseller and company level
Tracking vehicle status just got simpler. Earlier, sleep mode configuration was available on vehicles only. We’ve introduced sleep mode duration configuration at reseller and company level. The new update ensures accurate vehicle visibility on live tracking and across the whole system. If the device stops receiving data it is marked as inactive. This helps to maintain accurate vehicle status and avoids confusion when incorrect data is shown.
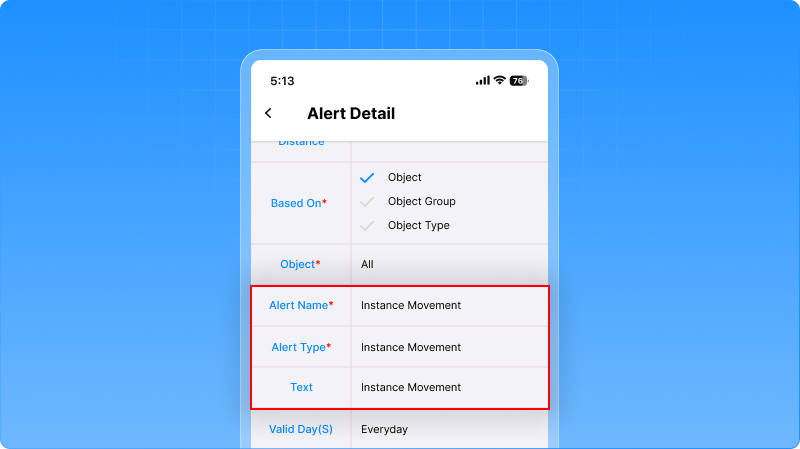
1.9 New instant alert introduced for vehicle movement data
A new instant movement alert has been added to detect vehicle movement. Earlier, alerts were based on events detected.
What’s new?
- A new instant movement alert is available under the general alert category .
- The system will trigger an alert when any movement is detected from port 303.
- Users can receive notification alert via application, email and sms
- The alert will be enabled on web and mobile both.
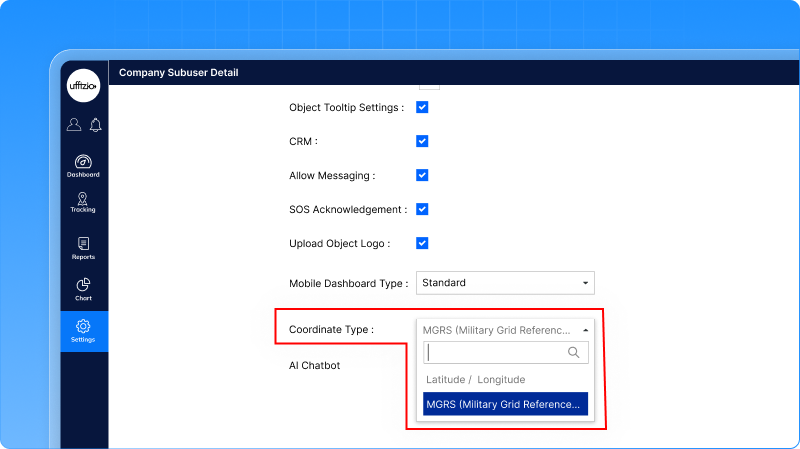
1.10 Choose preferred coordinate display type in user setting
A new coordinate type setting is introduced to give users more flexibility in how location data is viewed across the platform.
What’s improved?
Users can now choose how the coordinates are displayed within the system:
- Latitude/logitude (default)
- MGRS (Military Grid reference system)
This setting is available under :
Settings->General->User->User setting
How it works
- The selected coordinated type is saved at the user level.
- All location data is displayed in the chosen format across the platform.
- When MGRS is selected, the system automatically converts latitude/logitude into MGRS using conversion logic.
- The selected preference is applied to all the coordinates- the screen , tooltips and exported reports.
Supports military, security and government fleets especially where MGRS is required. This gives clarity for teams working with grid-based location systems.
1.11 Driver activity widget added to the tooltip section for live tracking module
Sometimes, knowing details like vehicle name,location, speed and driver information isn’t enough to understand how a vehicle is used throughout the day.
To fill this gap, a new driver activity widget is added to the tooltip section on the live tracking page.
This lets users know how many drivers were allocated to a particular vehicle on the current day from the live tracking screen.
Now with created widget
It displays the total drivers allocated for the current day. Clicking on the widget a popup screen will appear which show detail information about :
- Driver name
- Driver mobile no.
- Allocated from : date time
- Allocated to: date time
The functionality will remain the same just exactly as other widgets whether rearranging, visibility settings and save options.
The setting set by a user will be an entirely mobile application with the same layout, order and visibility.
![]()
1.12 Better tracking with driverless driving alert for running vehicles
Fleet managers get real time visibility with the driverless driving alert added to the alert configuration section. These alerts help to detect and prevent unauthorized vehicle movement without an assigned driver and improve fleet security and control.
What’s updated?
- We’ve added a new field duration tolerance for clients so they can set number of seconds between 60-600 before the system triggers an alert.
- Get notified only when the vehicle continues running after it exceeds tolerance duration ahead.
- The alerts will be generated when the vehicle’s speed value increases from 5 (Default) and maximum value 120.
This enhancement is quite useful for teams when there is a need to take immediate action when suspicious movement happens. Minimize the chances of damage, misuse or theft.
![]()
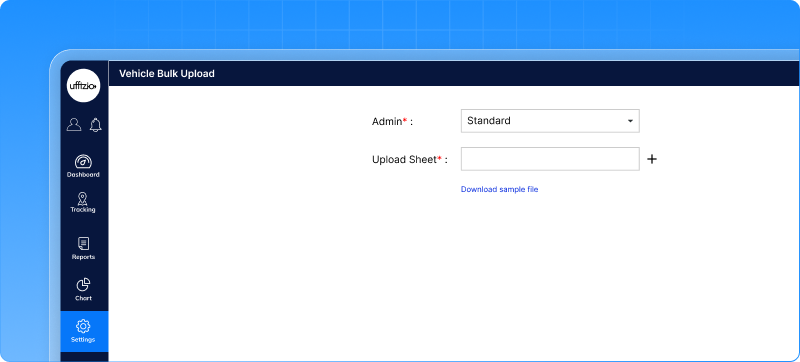
1.13 Bulk object insert feature access for admin users
The bulk object upload feature in the mobile application is now available for admin users. Earlier, only super admin had access to this functionality. With this update, admin users can now upload vehicle data in bulk using the same screen, format, validation and processing logic already in place.
What’s improved
- Multiple vehicle data can be uploaded without dependency on super admin.
- The system automatically selects logged-in admin to prevent incorrect upload.
- The admin selection field is disabled to maintain account-level control.
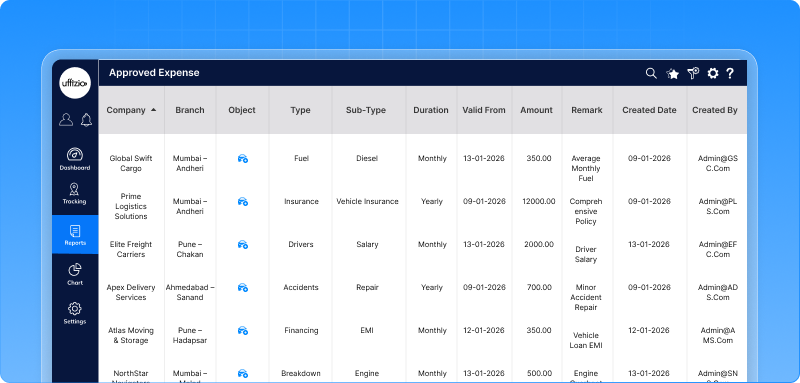
1.14 Approval expense is now added in object profile and expense report
Many operations rely on this important factor i.e Expense. It helps to track, verify and control operational cost. Managing expenses becomes difficult when there is no budget limit for every vehicle.
With this enhancement, the system now supports approval expense limits per vehicle and tracks actual expenses against it.
What’s new ?
- Approved expense
A new approved expense screen is created under Setting-> Masters->Approved expense
To make things easier, we’ve added approval expense filter including – company, branch, object, expense category, type, sun-type, duration, valid from, amount, remark, created date, created by etc
Screen access is user controlled and editable according to rights given.
- Approved vs actual expense
A new report is introduced: Reports ->Expense>Approved vs actual expense to compare.
The reports allows users to :
- View approved expense and actual expense
- See variance amount and variance %
- They can identify condition through colour that indicates:
Red – Over budget
Green – Matched
Blue – Under matched
- Expense chart analytics
This report also includes a trend chart which shows :
- Approved vs actual expense over time
- Highlights deviation percentage
The reports can be exported via excel, pdf and csv format.
This enhancement helps in controlling cost and budget for every vehicle. Detects overspending early. It helps in making better informed-decision based on approved vs actual expense.
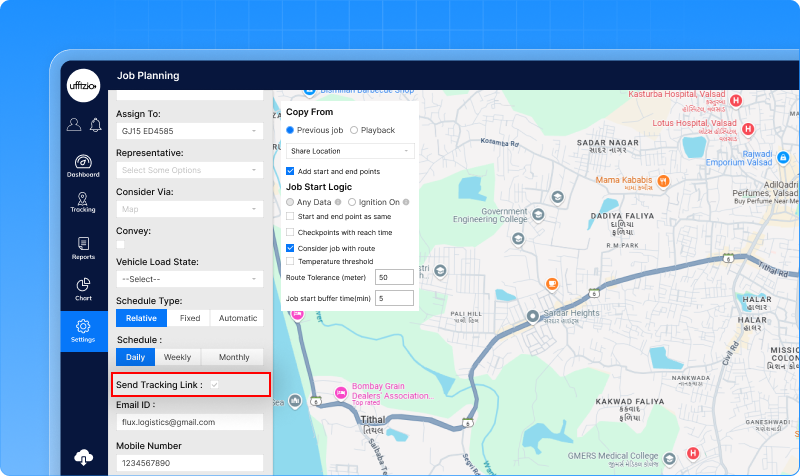
1.15 Automatic job location share
Uptil now, we had functionality to share the live location link from the live tracking screen once the job gets started. There was a missing link from where the link can be further shared via telegram and sms.
Now, users can use the job share section under – Setting->Master->Job planning with filter options includes email, mobile number, chat id and extended with telegram and sms as well.
Once the job starts running the location link will be generated automatically and then can be shared.
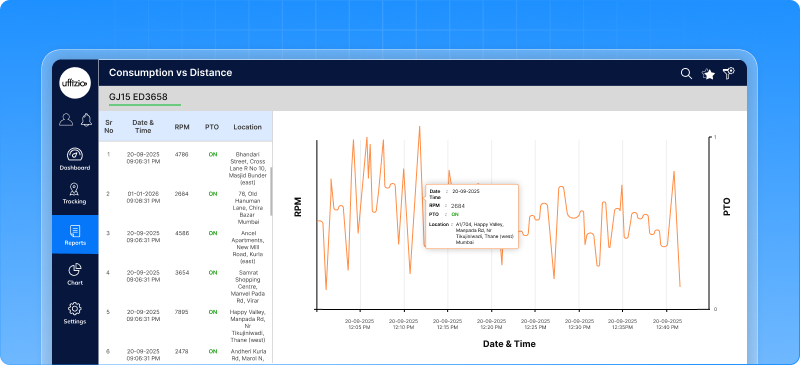
1.16 PTO values is now visible on the RPM chart
The RPM chart usually shows how the vehicle’s engine performs during the trip. Earlier only RPM values could be seen through the chart. With this enhancement, PTO values are visible on the RPM chart now as a separate data line. Users can select or tick PTO to show or hide the data on the chart. The value will be seen only if it is enabled. You can view the data from the left-side panel on the chart and can be exported in pdf format.
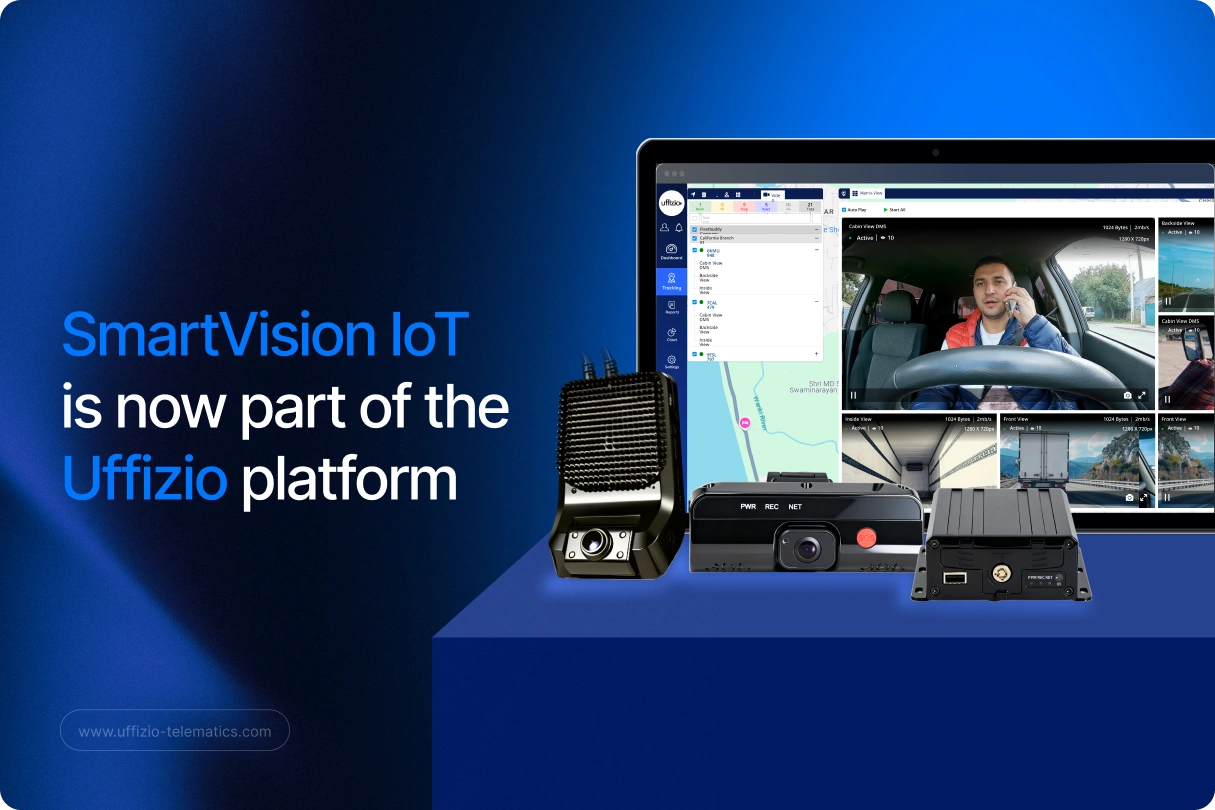
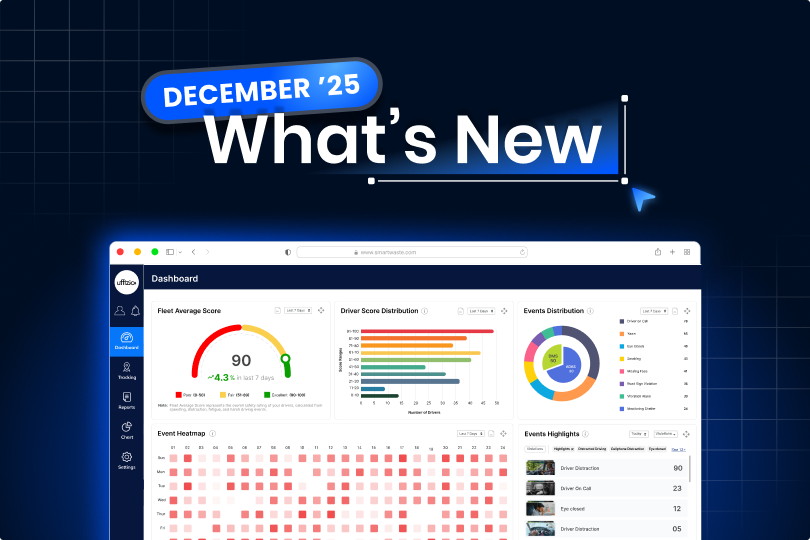
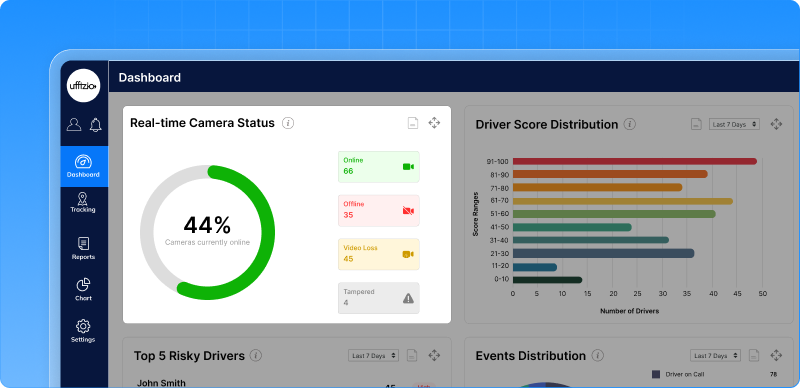
1.17 New updates added to video telematics dashboard
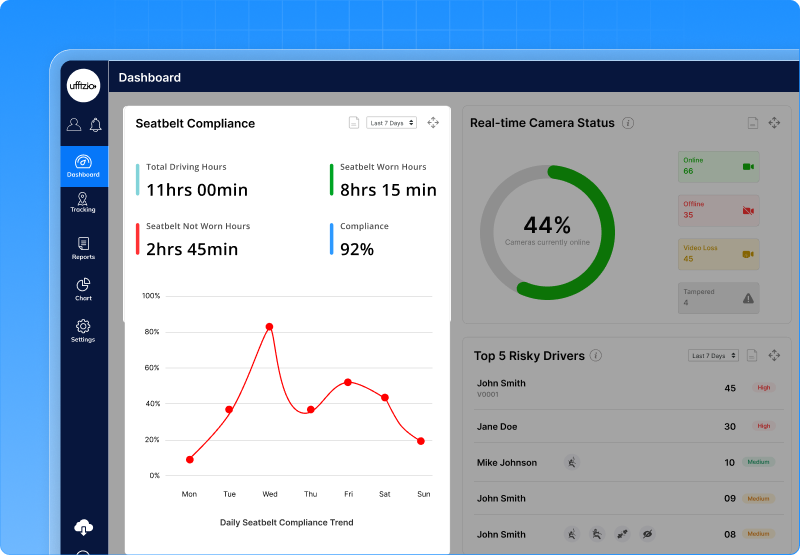
Fleet managers rely on video telematics dashboards to monitor vehicle safety. But getting a clear view of real-time activity, identifying risky events and which driver or vehicle needs attention was difficult. To address this challenge, we’ve upgraded the video telematic dashboard with new sets of widgets. This helps managers to act quickly, spot unsafe behavior and maintain safety across the fleets.
The updated dashboard now includes
Real time camera status panel
- Show the live status of vehicle cameras across fleets.
- It indicates whether the camera is online, offline or malfunctioning.
- Helps managers identify camera issues and ensure the video footage is recorded every trip.
Event stream carousel
- Displays live thumbnails of video- based driving events like phone usage, lane departure and tailgating etc
- Quicker access with just a click helps when an incident occurs.
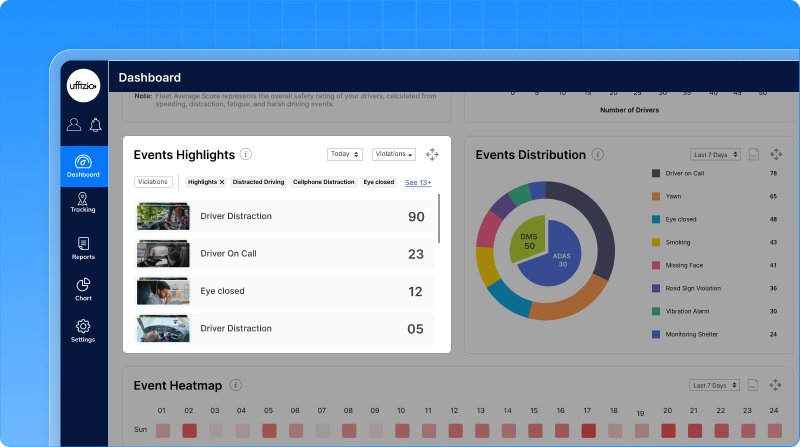
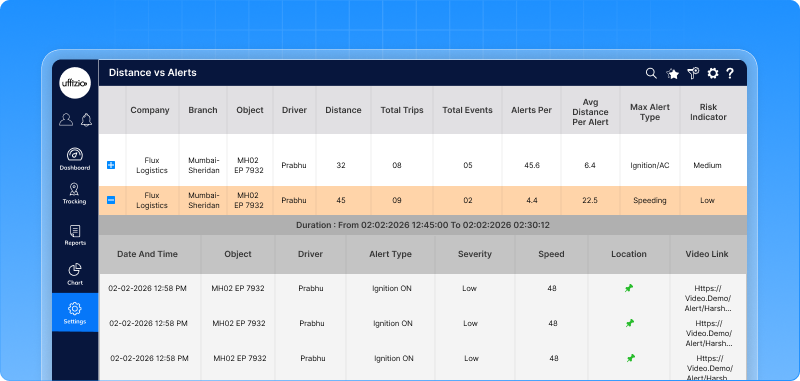
Alert vs distance graph
- This graph compares the distance driven and numbers of alerts generated over time.
- Helps to understand how alert volume changes with fleet activity.
- Support better analysis of driver behavior and safety trends through visual comparison.
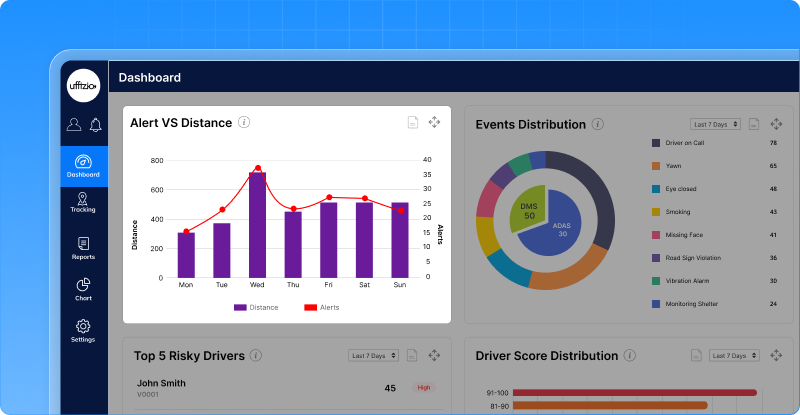
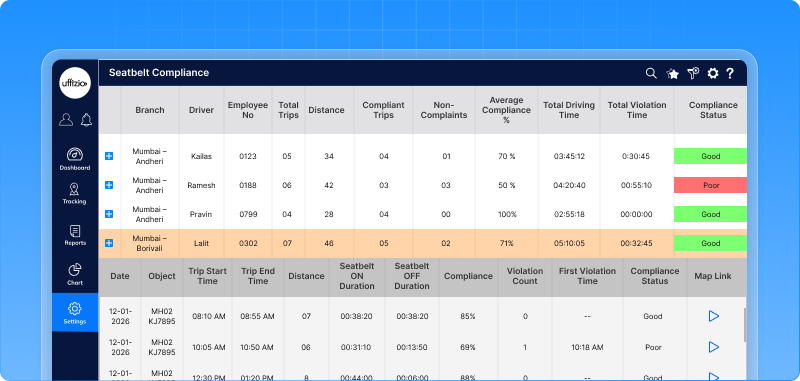
Seatbelt compliance widget
- Shows the percentage of driving time where drivers are detected wearing seatbelt.
- Highlights non-compliant hours and related seatbelt alerts, making it easier to identify unsafe behaviour patterns.
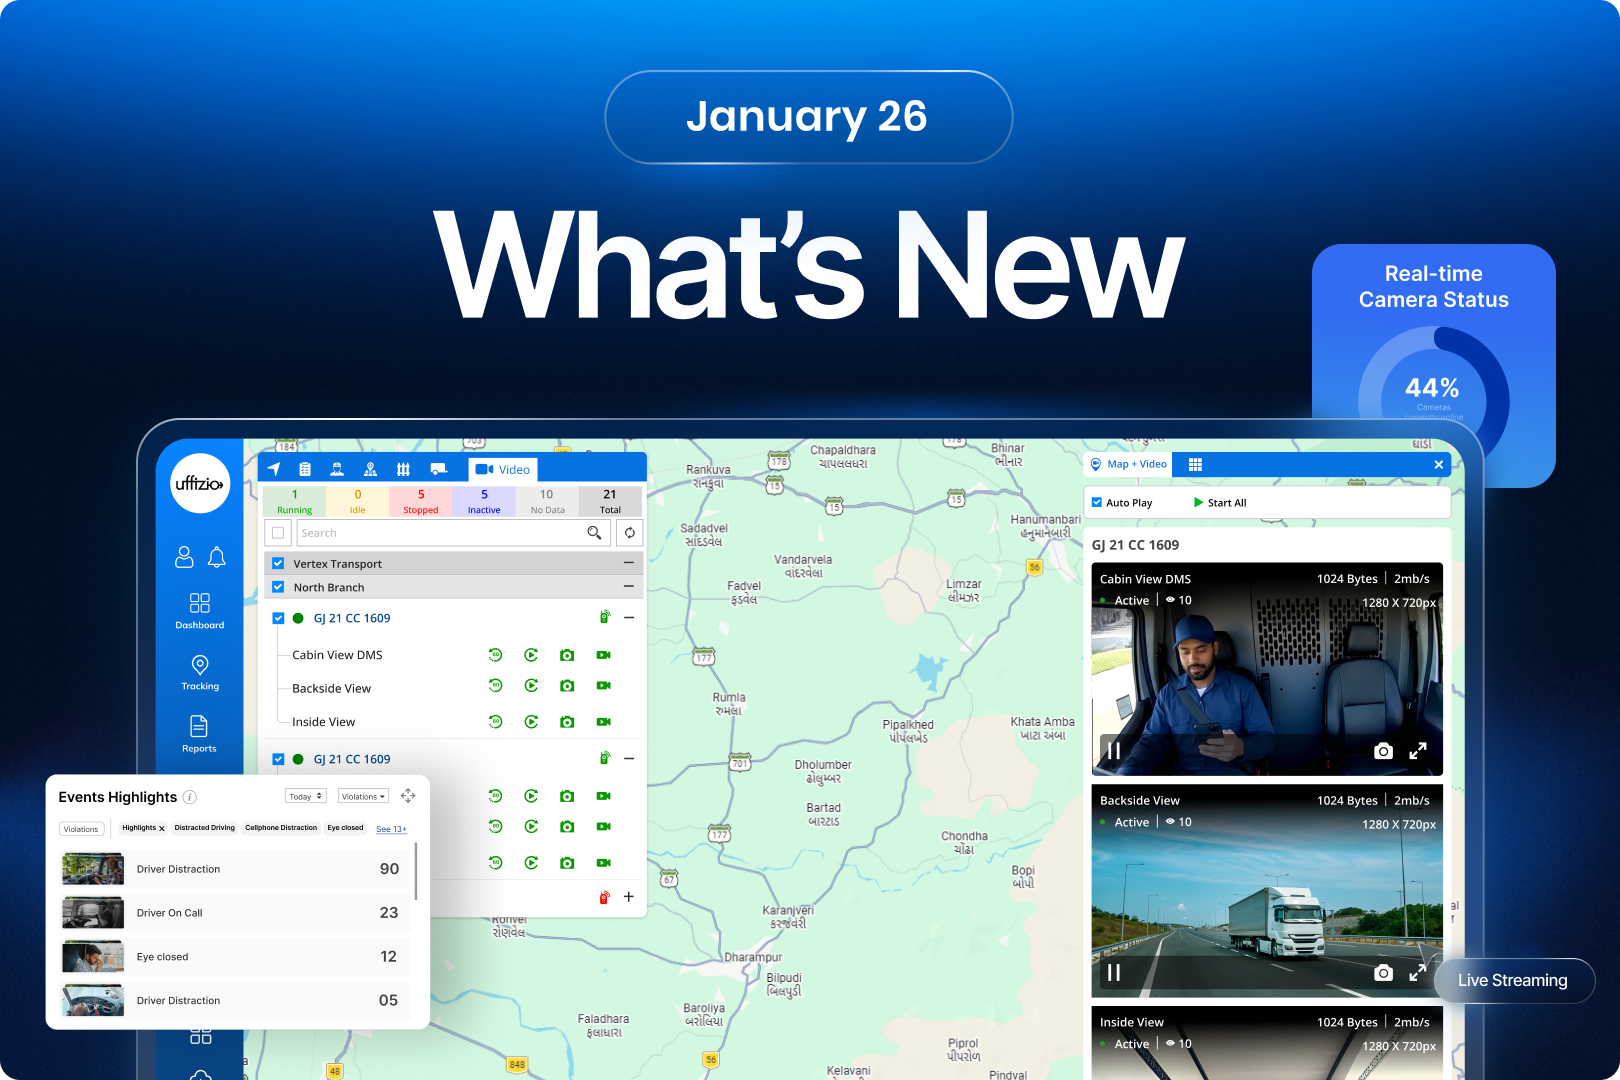
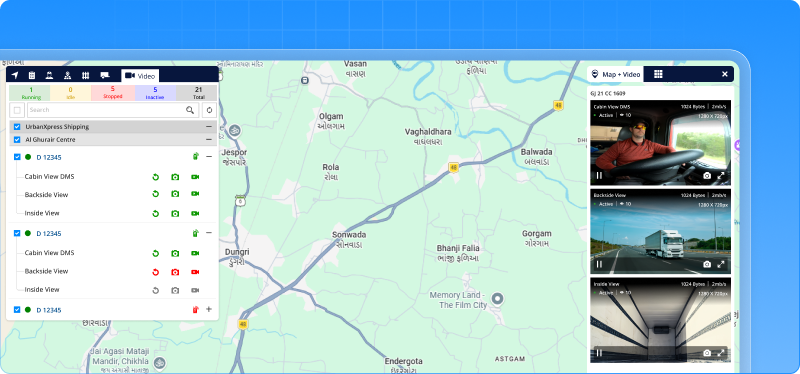
1.18 Smarter live tracking with video telematics
What live tracking show
Real time video feed
- Enables live streaming from front facing and driver-facing dashcam directly on the live tracking map.
- Instead of guessing why the vehicle stops, managers can immediately check distraction, collision ahead or driver fatigue and response faster.
Replay last 60 seconds
- Users can now replay the last 60 seconds of video footage for any vehicle with a single click.
- This allows users to quickly review recent road activity without navigating through recordings or timelines.
- This feature helps to understand what just happened, supporting faster verification and timely action during live monitoring.
Driver recognition badge
- Displays driver photo along with name when detected by face recognition.
- Helps visually confirm who is driving the vehicle.
- This improves driver accountability and especially in shared vehicles.
![]()
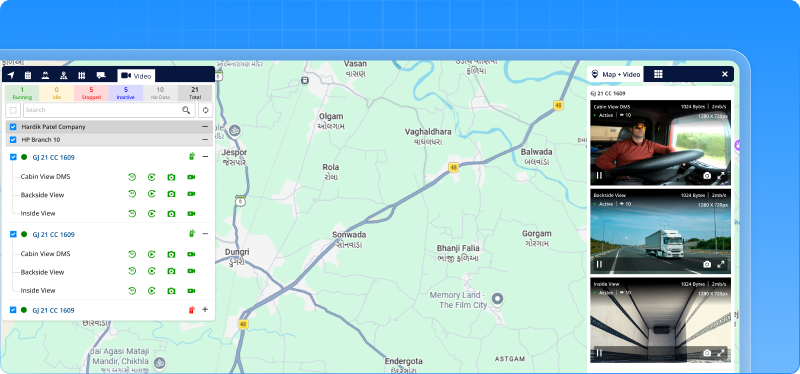
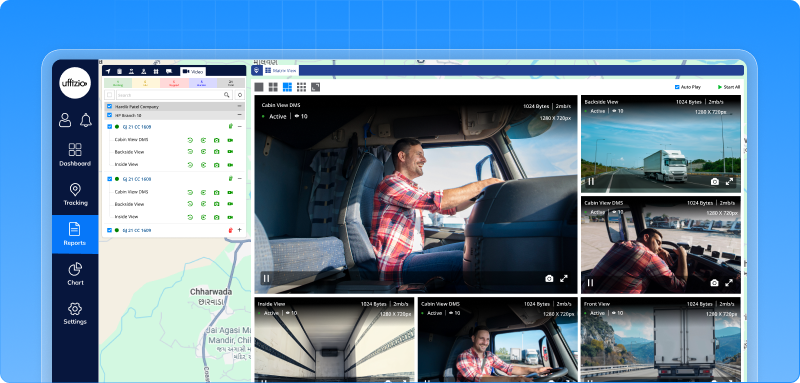
Multi-cam view
- Users can now see the multiple vehicle live streaming at the same time on screen.
- Enables faster supervision without switching between screens.
- Supports real-time monitoring across active fleets
Status bar on map
- Introduces a status bar on live tracking map showing vehicle and driver indicators such as ignition on/off, seatbelt status, fatigue and distraction etc.
- This makes it easier to track critical driving events for the vehicles on the move.
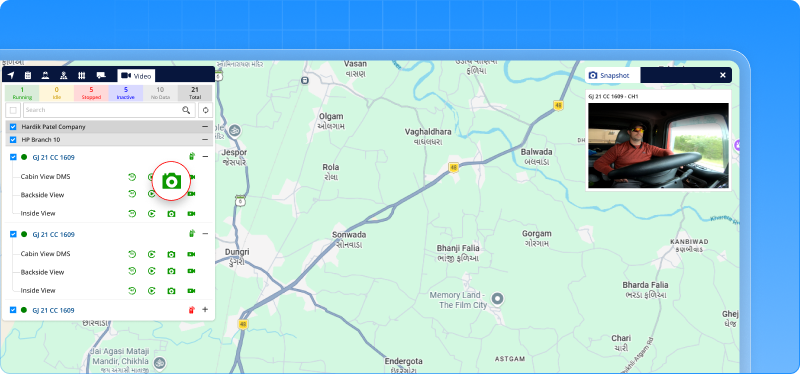
Screenshot capture
- Users can capture still image instantly from live video feed
- The capture happens while the vehicle is being tracked in real time
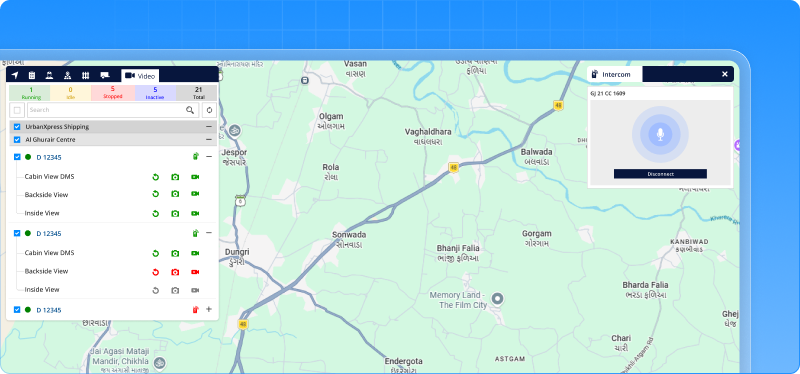
In-cabin audio stream
- Allows users to listen to real-time audio from inside the vehicle cabin.
- Helps understand in-cabin situations alongside live video and location.
1.19 Reports enhancements made in video telematics
Updated reports now offers clear insight
Seatbelt compliance report
- Shows seatbelt usage report as per trip-wise and driver-wise and helps to understand whether drivers are following seatbelt safety rules.
- Identify seatbelt violation across trips with the assigned drivers.
Distance vs event report
- The distance vs event reports helps identify vehicles and drivers with highest alert per km.Comparing the distance traveled with frequency of alerts events generated over selected period of time.
- Enables distance comparing even when the distance converge is low
- Supports safety scorecards and performance analysis. Detects abnormal alerts for short trips and low-mileage.
- Helps managers conduct coaching sessions and compliance analysis.
2. Smartwaste Updates
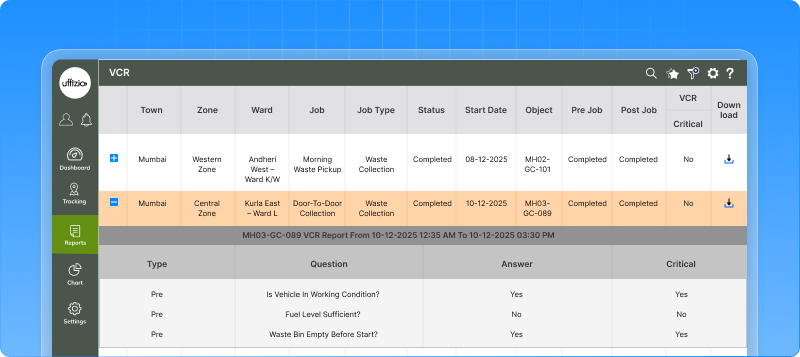
2.1 Vehicle condition report added under report section
We’ve added a new report in Smartwaste to help fleet managers monitor vehicle condition for each job and vehicle.
What’s added?
- They can monitor vehicle status from pre-job and post-job in a single report.
- Report data can be filtered by job name and date range.
- You can add attachments like images and documents with VCR answers.
- Users can download complete VCR report in pdf format
2.2 Collection address tag status is now simplified
Identifying the right collection address is now easier in the surveyor application. At first it seems identical on the map making it difficult to understand whether the right tag is installed at locations.
To improve the visibility and usage, the map view has been enhanced to visually differentiate collection addresses based on tag installed status.
What’s improved ?
- Collection address with a tag installed (tag with number) shown in one distinct colour.
- Collection address without a tag installed (tag without number) shown in different colours.
- The differentiation is driven by absence or presence with the tag number.
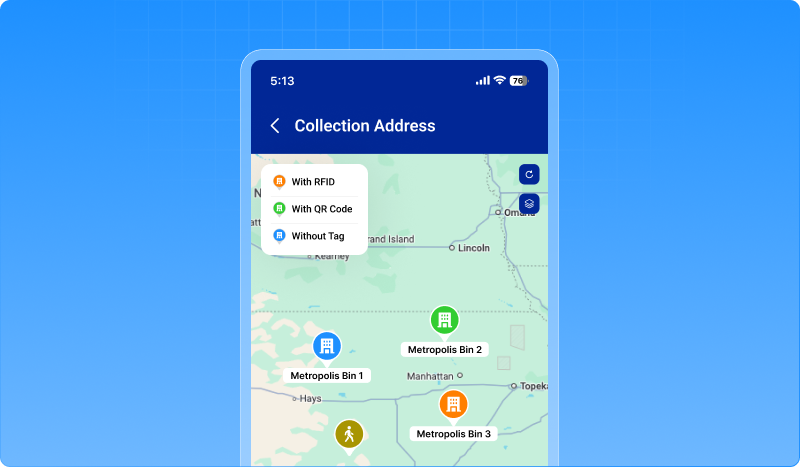
This update allows surveyors to identify tagged and non-tagged locations on the map and reduce confusion and improve efficiency during field operations.
2.3 New Complaint module created on live tracking screen
The complaint module is now integrated into the live tracking screen to simplify operations.
With this enhancement, users can view and manage complaints in real time while tracking vehicles and field activity.
A new complaint tab is added to the object list inside the live tracking screen.
The system allows status (open, closed, total) with search bar and filter options.
Existing complaint screen opens up when clicked when the ‘add compliant ‘ icon is clicked
Detailed complaint information is visible on the right-hand side panel where cards show subject, location, category, attachments and owner details.
Complaint can be :
- Assigned to existing jobs with map-based selection
- Added to new job if necessary
- Marked resolve once the action is completed
![]()
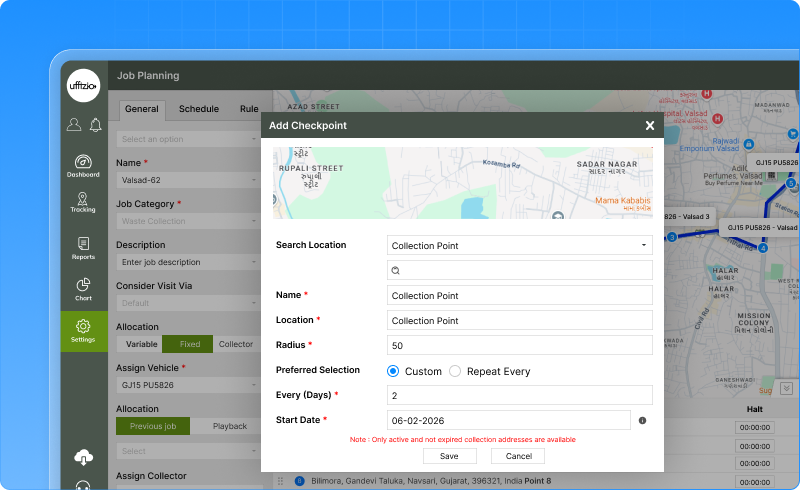
2.4 Checkpoint level start date for repeat every selection in fixed allocation jobs
Earlier, when creating a job with selection type = repeat and preferred selection = repeat every, checkpoints followed the job’s schedule automatically.
There was no option to define a start date at the checkpoint level.
What’s new ?
- You can set a start date for every checkpoint when using repeat every option.
- Start date can be selected using a date picker. Now checkpoints repetition frequency (Every x days ) will begin from the checkpoint start date.
- The start date must be between valid from date to valid to date.
This enhancement is available across:
- Single and multiple checkpoints
- Collection address and collection address group
- Bulk option upload
Bulk upload update
- A new column has been added ‘ start date ‘
- If repeat every is used, start date becomes mandatory
This makes scheduling jobs accurate, reduces confusion for field teams and avoids unnecessary changes.
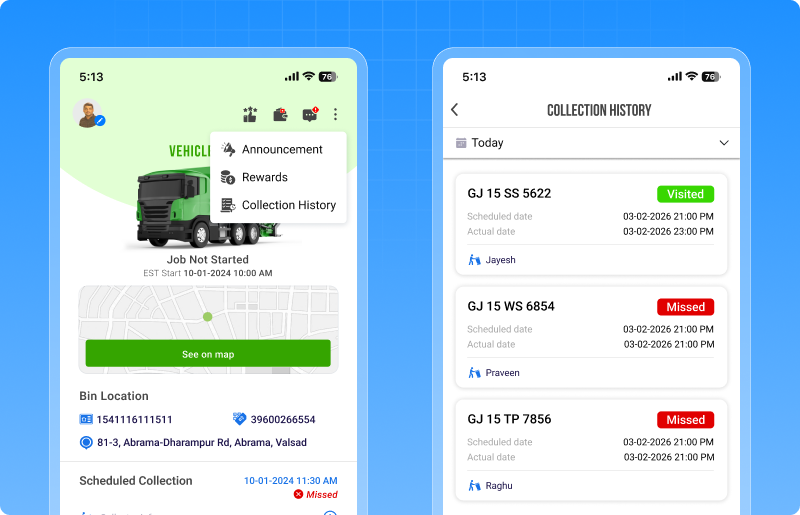
2.5 Collection history and collection address details added in citizen application NSWM-3600
Citizens can now view their waste collection history for the last 30 days directly in the application. This section shows scheduled collection date, collection status (visited or missed )and actual time of collection. Collection status can be identified based on colours.
To help users find information, filters such as Today, Yesterday, This week, This Month and Last Month are available. If any record exists fewer than 30 days, all data will be displayed.
Additionally, citizens now can clearly see Tag ID and property number after logging in. And if changes are made will automatically get updated in the Tag ID/Property mapping.