Simplify fleet analysis with weekly automated reports

Introduction

Every fleet operation produces hundreds of data points every day – fuel refills, tire changes, trips, driver behavior, alerts, maintenance logs, and safety incidents. But turning all that data into meaningful insights takes time and effort. Trakzee’s Weekly Automated Fleet Reports bring everything together into a single, easy-to-understand summary. Delivered automatically to managers every week, these reports provide a complete picture of fleet performance, expenses, and safety – without any manual work.

Challenges

  • Data scattered across modules → Managers have to manually pull reports from fuel, maintenance, and driver performance dashboards separately.
  • Time-consuming analysis → Compiling weekly summaries from multiple systems wastes valuable time.
  • Missed performance issues → Without consolidated reporting, inefficiencies in fuel use, tire wear, or driver behavior often go unnoticed.
  • Lack of visibility → Decision-makers struggle to get a unified view of operational costs and performance.
  • Reactive management → Teams act only when problems arise, instead of identifying trends early.

Solution with Trakzee

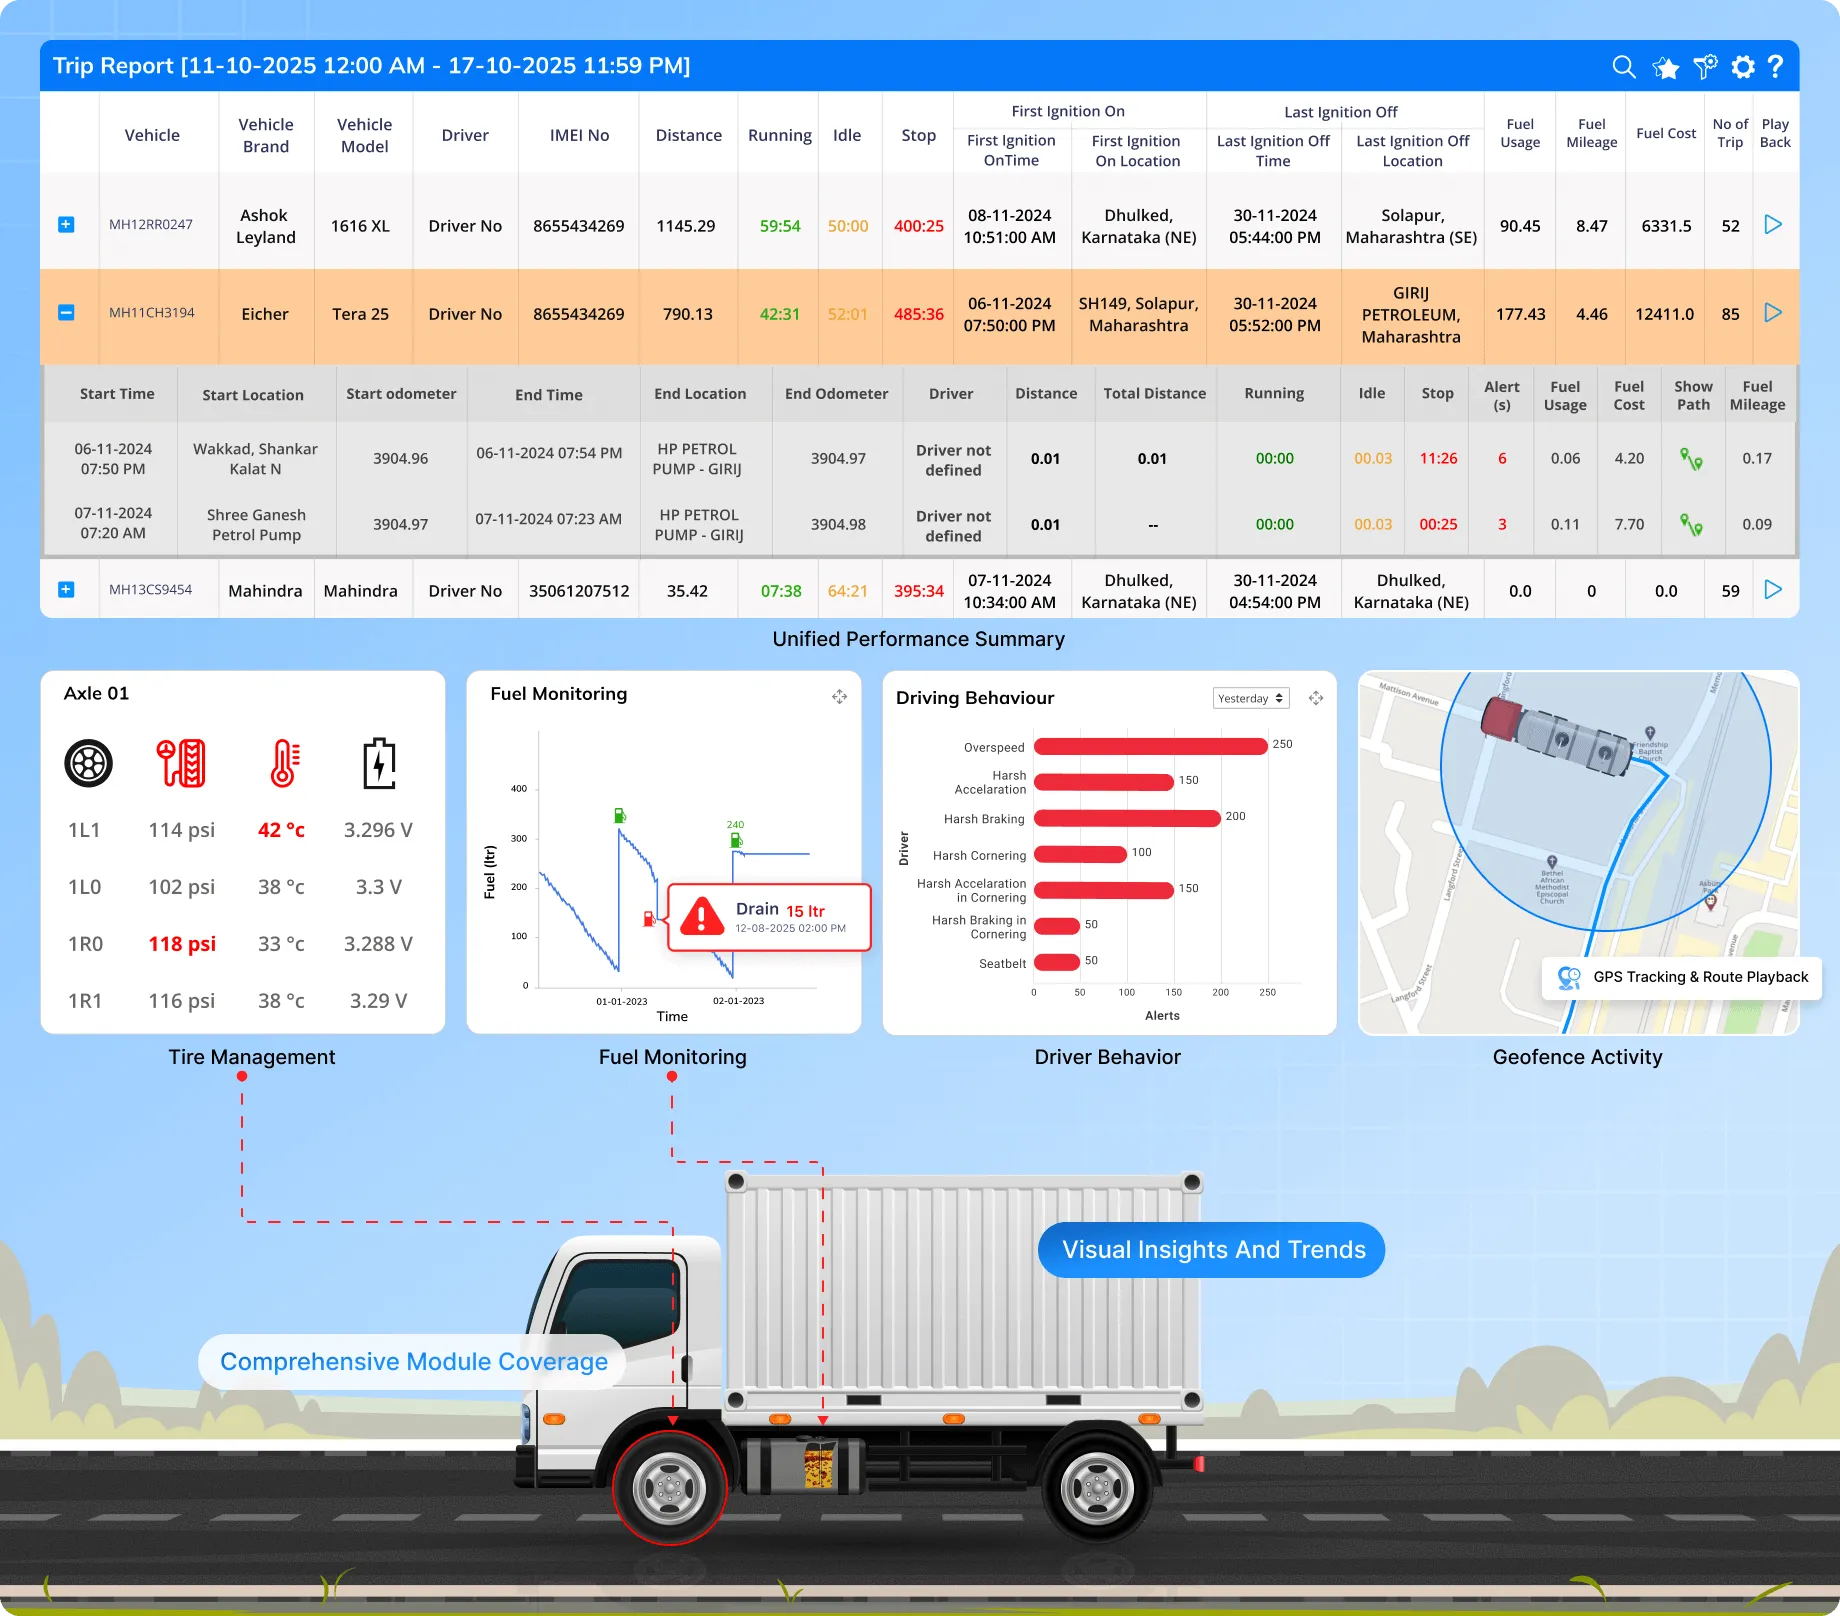
Trakzee automates weekly reporting across all key fleet areas — combining insights from every module into one concise, actionable summary.

  • Comprehensive module coverage → Automatically compiles data from fuel monitoring, expenses, tire management, ADAS/DMS, geofence activity, maintenance, trip history, and driver behavior.
  • Unified performance summary → Provides one consolidated report showing operational efficiency, safety, and cost trends.
  • Automatic scheduling and delivery → Reports are generated every week and emailed to fleet owners, branch heads, or clients without any manual effort.
  • Custom report configuration → Users can select which modules or KPIs they want in their weekly summary — from CO₂ emission trends to driver alerts.
  • Visual insights and trends → Highlights improvements or deviations through comparative graphs and summaries.
  • AI-powered observations (optional) → Detects anomalies like unusual fuel usage, repeated geofence breaches, or rising tire wear, helping managers act early.
  • Centralized visibility → Gives decision-makers a single report that reflects fleet health, cost control, and operational performance – all in one glance.

Results Achieved

  • 80–90% time saved on weekly report generation and analysis.
  • Improved visibility across all fleet performance parameters in a single report.
  • Proactive management with early trend identification across modules.
  • Better decision-making through automated, unified data summaries.
  • Higher productivity as managers focus on action instead of report compilation.

Let’s Move Forward, Together

Share your details and we’ll guide you from here.

Let’s Connect!