We have optimized Trakzee’s live-tracking screen: see toll details, GPS device status, and alert types here. We’ve also enhanced our fuel management module and added work hour reports. With new widgets on the SmartWaste dashboard and absentee markers on SmartBus—we really did go above and beyond to enhance our platform.
Before you dive into these updates, here’s our CEO, Mr. Tushar Bhagat, with a quick update summary:
Trakzee application updates:
1. Adding equipment work hours under Activity Reports
For certain industries, it makes sense to monitor the work hours in addition to the distance traveled. The productivity of equipment like trenchers, excavators, or bulldozers can be measured by their work hours. Hence, monitoring work hours can give businesses insights into overrun or underutilized equipment. It can also help businesses plan preventative maintenance schedules. Thus, saving them from expensive repairs and equipment downtime.

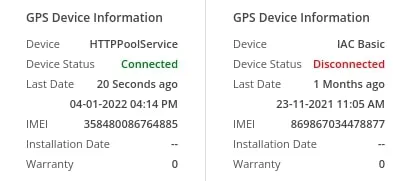
2. GPS device status on the live-tracking screen
Trakzee users will see whether their device is connected through the GPS device information widget—added on the tooltip. This is now available on the live-tracking screen. To access this information, users will be required to enter the time duration in HH: MM format in the Device Connectivity field (under the Company Menu). Knowing the status of your GPS device is important for real-time data.
3. Select a time frame to view reports
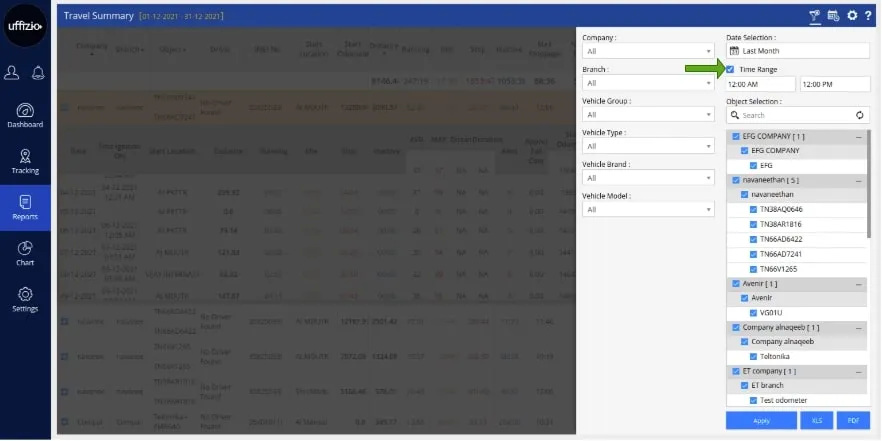
Are your fleets working from 9 am to 5 pm? Then why are you getting reports with 24 hr data insights? Skip going through all this unnecessary data! Select a relevant time frame and get practical reports for only those times that your vehicles were working for you. This feature allows you to focus on relevant data and gives quick insights—that can actually help your business.
4. Alert-type displayed under the playback menu
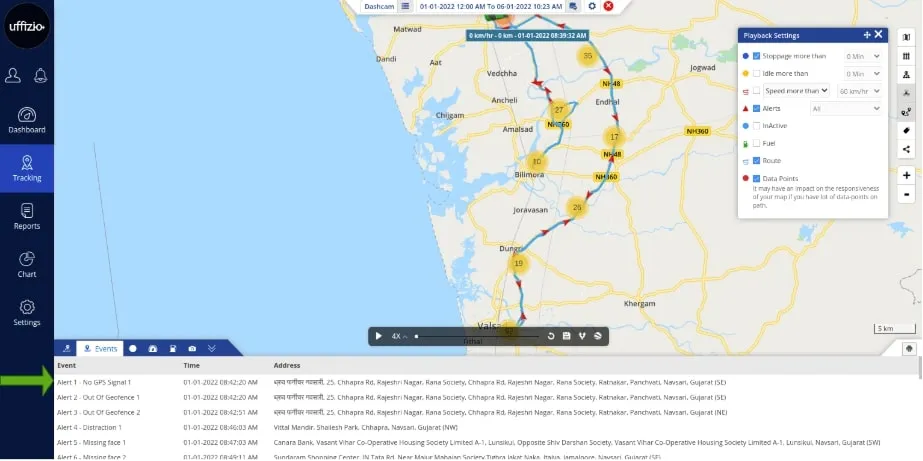
Now, Trakzee users can see the type of alert, like idling, over-speeding, or harsh braking, under the playback panel of the live-tracking screen. Alerts and their types will be displayed along with the location and the time of the event. This will help managers quickly evaluate drivers’ performance for any trip. See if your drivers are constantly over-speeding or idling. This real-time information can help in taking corrective measures.
5. Toll plaza and charges can now be seen on the live-tracking screen
Are your fleets going across multiple cities and states? Then, knowing upcoming toll plazas beforehand can be a great help. That’s why, now the users of the Trakzee app, will see toll plaza details under the Nearby option. You will see the upcoming toll booth along with the payable amount of toll charges.

6. View a single object on the live-tracking screen
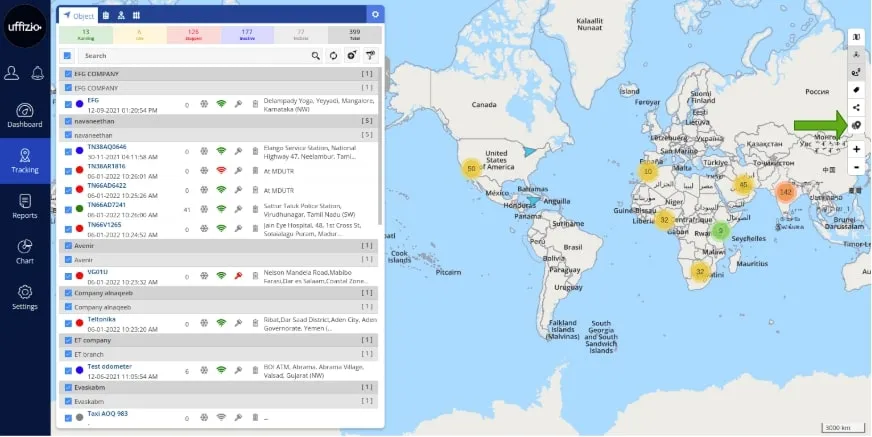
Using the live-tracking screen for hundreds of vehicles can quickly get exhausting. That’s why we are now enabling a toggle icon. This will allow you to see only the object of your choice on the map. For instance, if there are thirty vehicles in a parking yard, but you are primarily interested in car A. Then, using the toggle icon, select car A and you will view only that object on the map (and not the remaining twenty-nine).
7. Calculating fuel consumption based on distance and duration
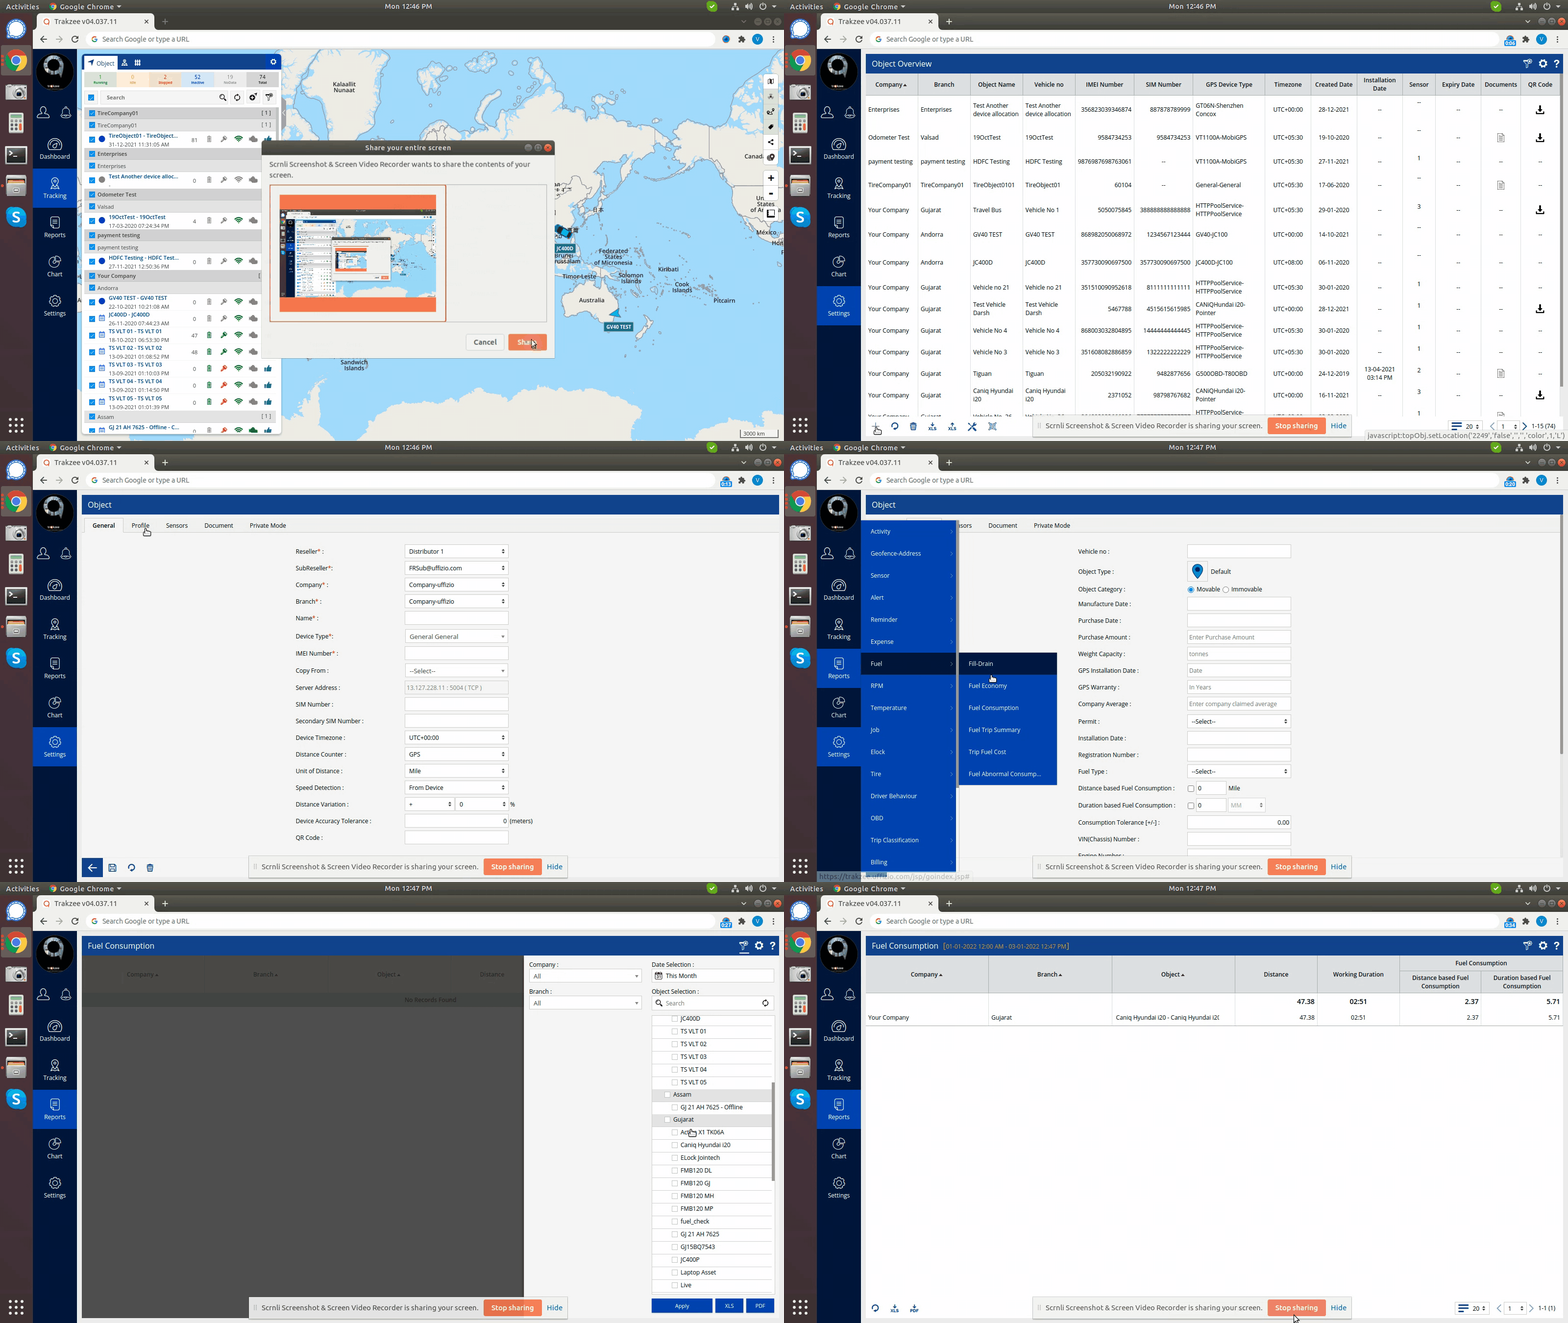
In the previous version of Trakzee, the fuel consumed by a vehicle was calculated based on its distance-based or duration-based mileage. This was strictly calculated per liter. Now, we have tweaked the calculations so that consumption can be calculated for any amount of fuel filled. Calculate the amount of fuel needed based on prior distance traveled or duration. For example: If a car uses 4 liters of petrol to travel a distance of 100km. How much fuel is needed to travel a distance of 350km? You can directly find this using the distance-based fuel consumption field. This configuration can be found on the object’s profile screen under General Settings, as seen below.
Updates on the SmartBus application:
1. Manual trip creation option in SmartBus
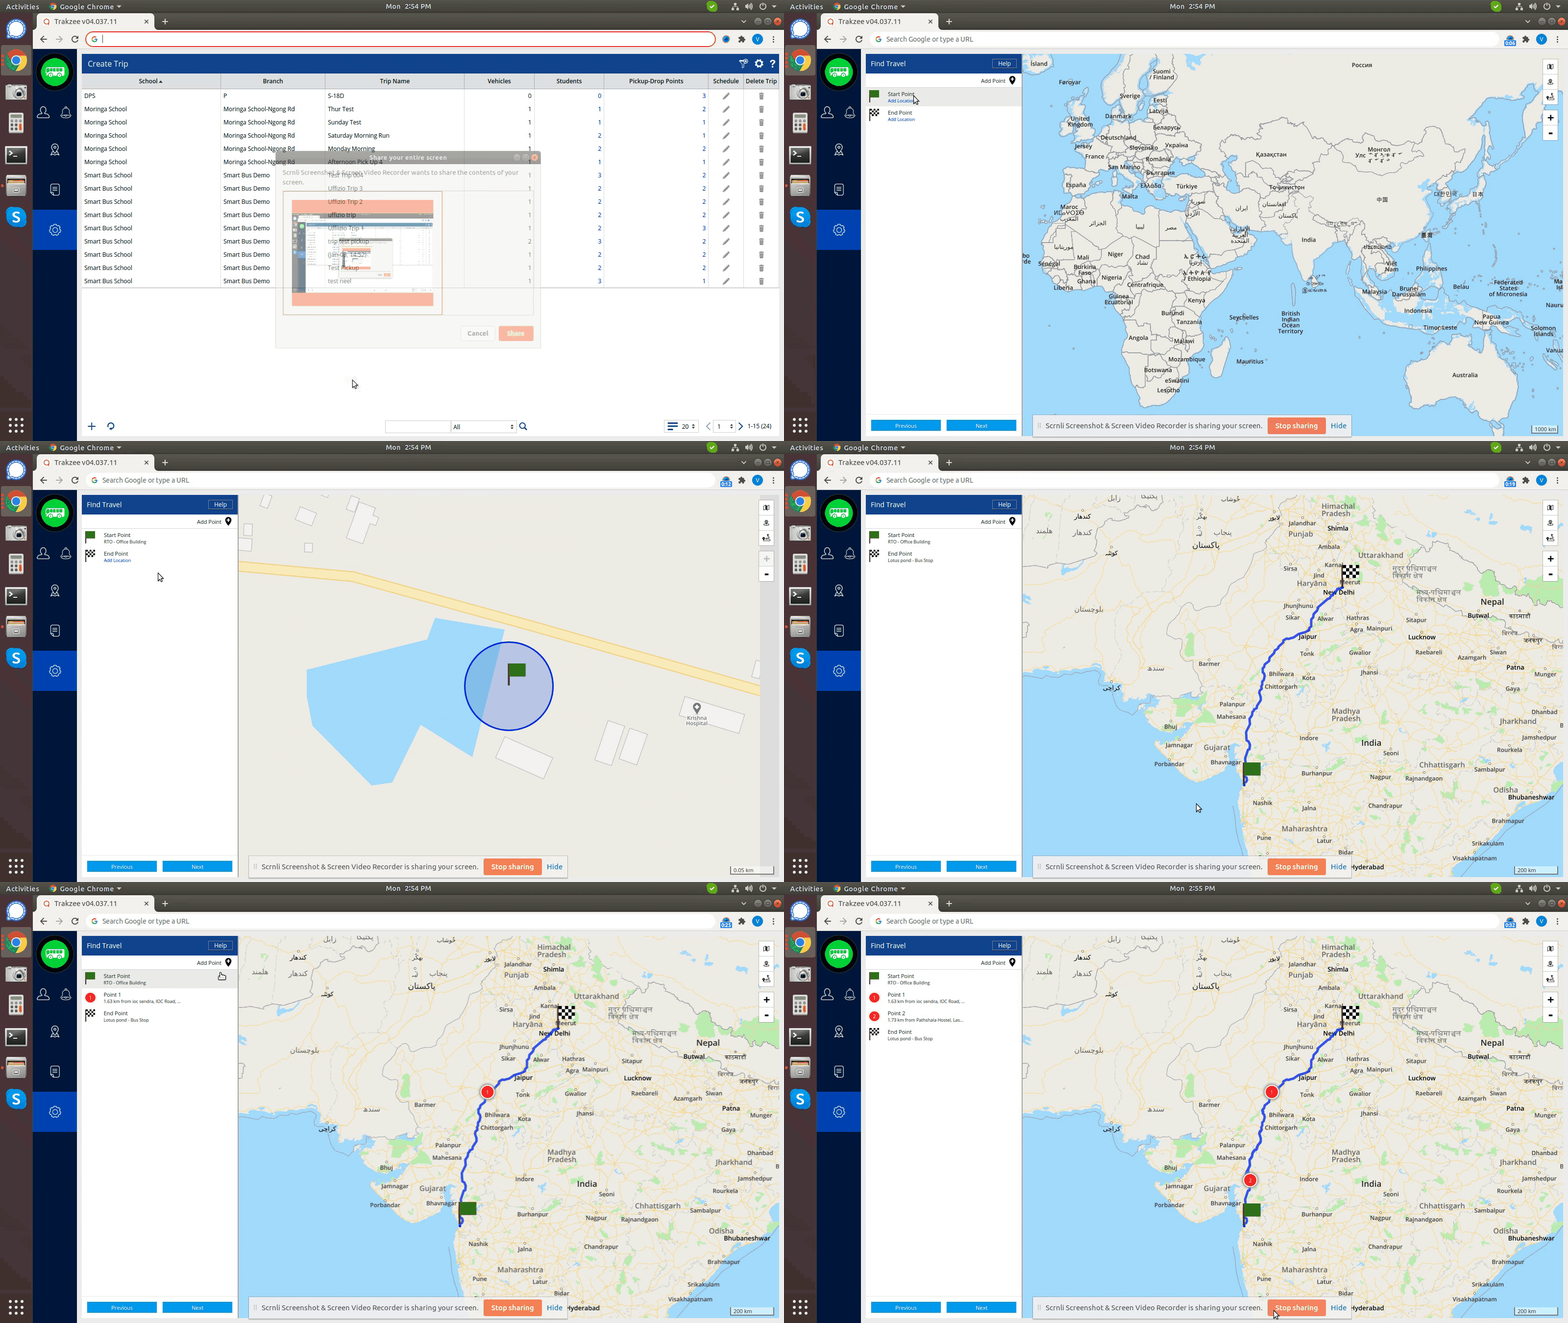
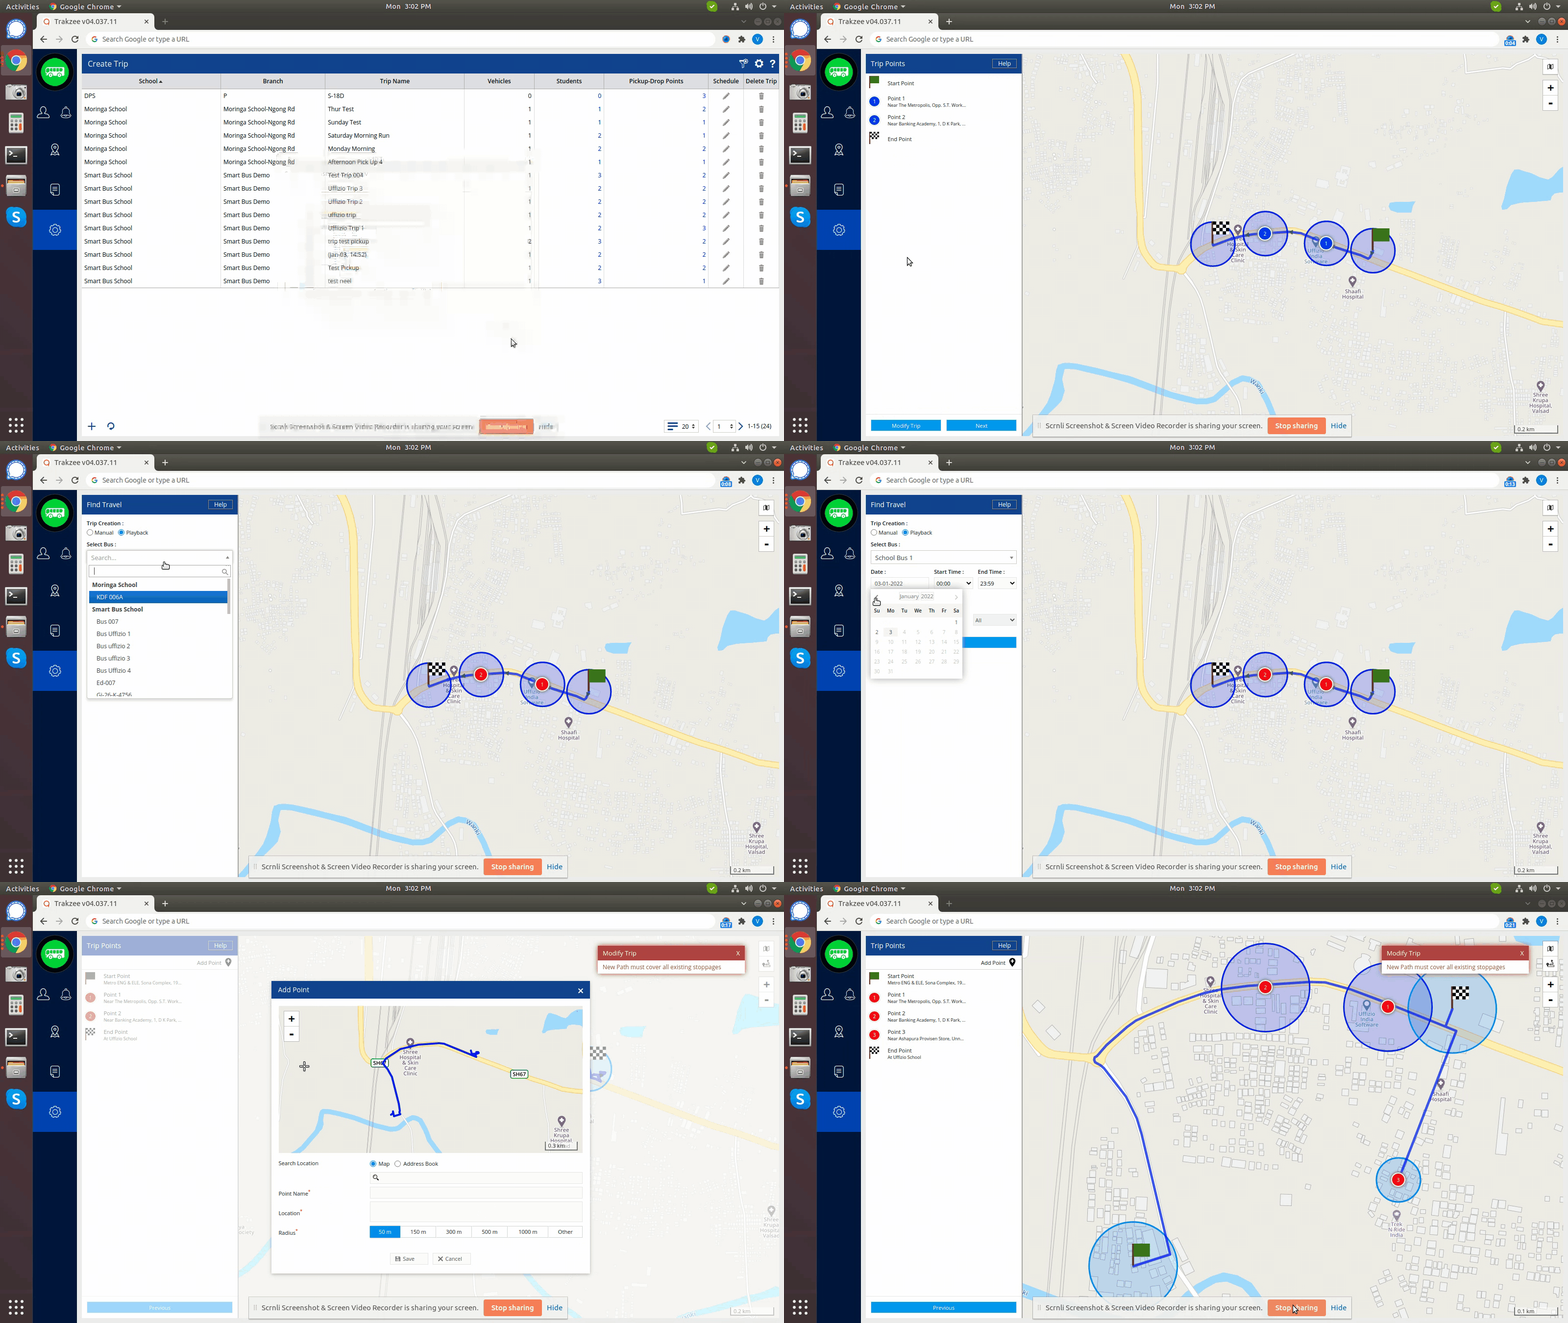
Now, trips can be pre-defined or created manually on the SmartBus application. With automated trip creation from pre-defined playback routes, there was really no scope for drivers or managers to add new stoppages. However, with the manual trip creation option, they can add unexpected stoppages and new locations. So, this feature lets the administration handle last-minute changes and unexpected stops.
(a) This is how you create manual trips on the platform:
(b) Add new points along the route:
Updates on the SmartWaste application:
1. New widgets on the Dashboard
We’ve added two new widgets on the dashboard of our SmartWaste application:
(a) Vehicle and Job Status
This widget tells you, in real-time, how many vehicles are deployed on a job. Knowing the total number of vehicles on the job and off the job can really help you with resource allocation and better task planning.
(b) Area Analytics
Using this widget, you’ll exactly know where your vehicles are. Some could be parked in a yard or dumping waste at a transfer station. Knowing how many vehicles are at what spot can again be very useful for planning new waste collection trips and resource allocation.

2. Changes in the Citizen App
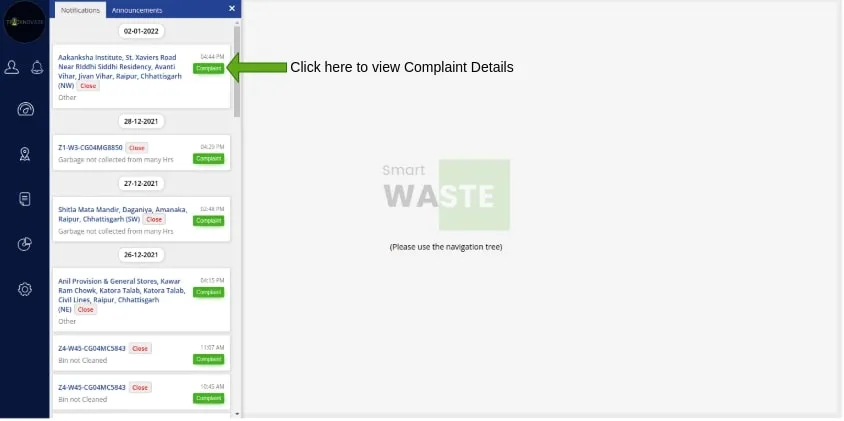
We created the citizen app to foster transparency between the citizens and waste management administrators. Using the Citizen App, anyone could register a complaint about tardy waste collections. Authorities could see these complaints in real time and respond accordingly. When a complaint was addressed, the authorities could close the thread. But this is when it gets interesting! Now, citizens can look back at the response and re-open the thread if they are not happy with the way their complaint was handled. Reopening raised issues gives more power to the citizens and coerces the authorities to take every complaint seriously.
LogyTrak Updates
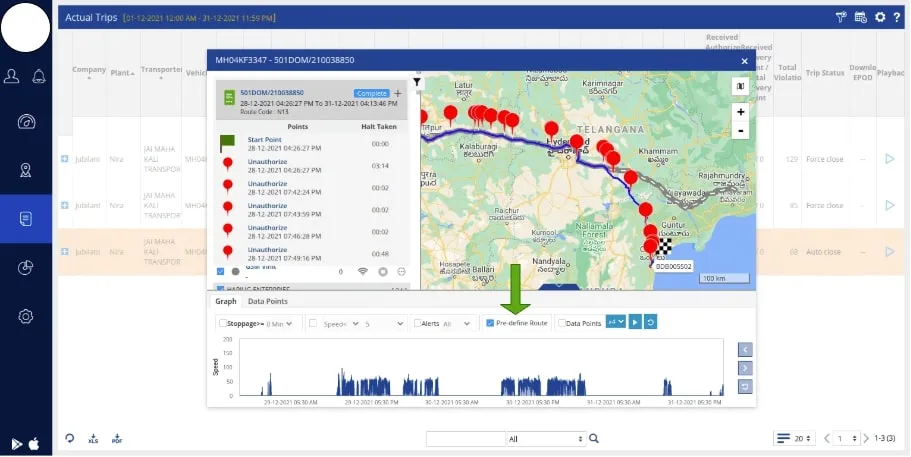
1. Adding Route Comparison feature under the Playback menu
The trucking industry lives and dies on the road. Therefore, it is important to monitor travel routes carefully. The Route Comparison feature lets you do exactly this. Using it, you can compare original routes with actual routes. This can help managers track unwanted stoppages and route deviations. Knowing how often your driver stopped or went away from the original route is important. It can help train drivers and can bring down idling times. For precious cargo, knowing route deviations can be an important step in preventing theft or pilferage.
