We believe the best innovations come directly from those who use our platform every day. That’s why the latest enhancements are thoughtfully developed based on valuable feedback from our clients. Each update is designed to simplify operations, improve usability, and deliver a smoother, more efficient experience—helping businesses get more value with less effort.
1. Trakzee updates
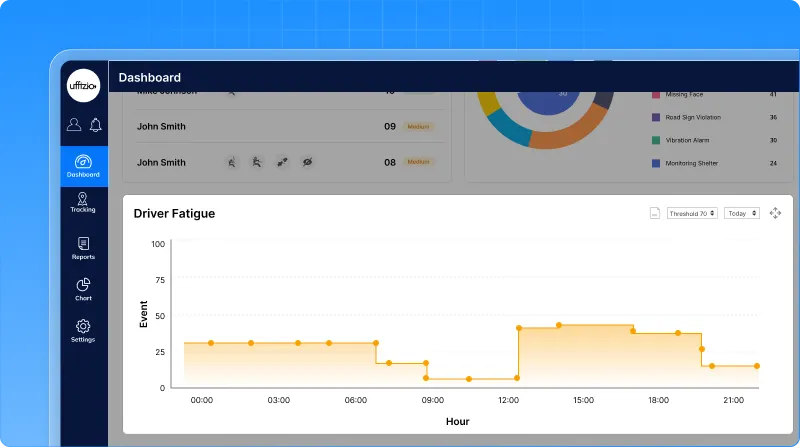
1.1 From Hidden Risks to Instant Insights: Driver Safety Now on Your Dashboard
In fleet operations, risks like driver fatigue and drowsiness are critical but they are often identified only after reviewing reports. This delays action. Now, these insights are available directly on the dashboard.
What we fixed
Now, a new driver safety widget has been added to the dashboard, bringing all key risk insights into one place. This widget includes:
- Drowsiness detection
- Driver fatigue trends
- Top critical trips (risk-based)
All visible without navigating to detailed reports. This helps to see:
- How drowsiness levels change over time
- How fatigue builds during trips
- Which trips carry the highest safety risk
 Why this matters
- Spot unsafe driving behavior early
- Take faster action without deep analysis
- Improve driver safety and compliance
- Reduce risk across fleet operations
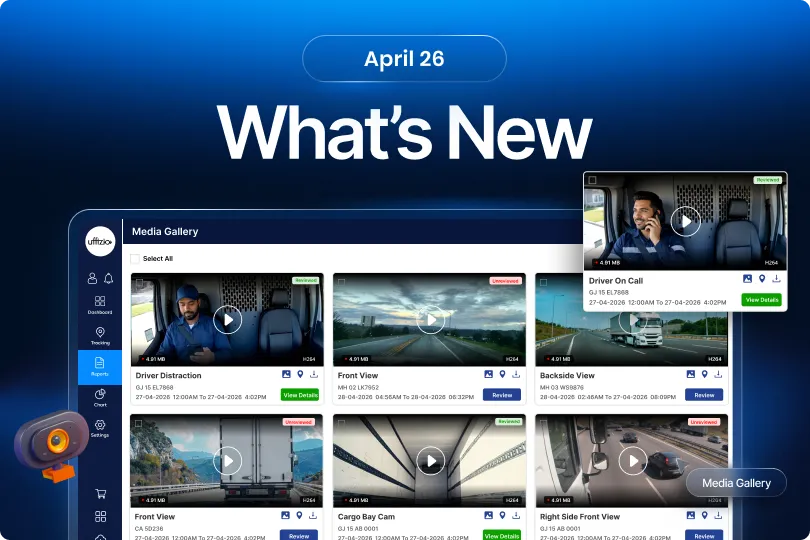
1.2 Turn ADAS/DMS events into action with review management
ADAS and DMS events generate valuable video evidence. But earlier, there was one big gap:
- No way to track if events were reviewed
- No visibility of pending safety checks
- No accountability on who reviewed what
This made it easy to miss critical safety events. Now, that changes.
What’s changed
You can now:
-
- Mark events as Reviewed or Unreviewed
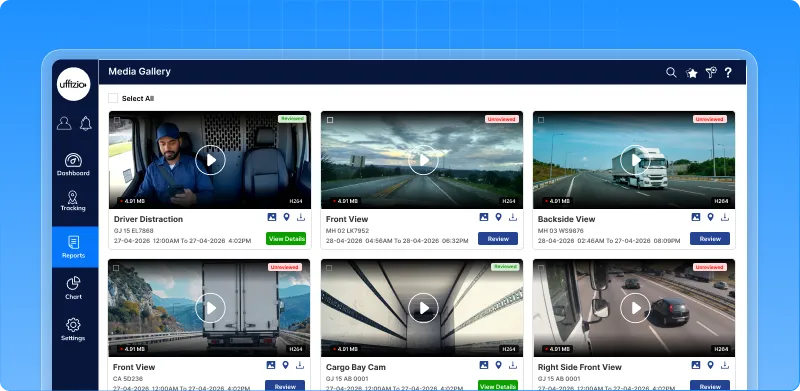
- Add review remarks
- Track who reviewed and when
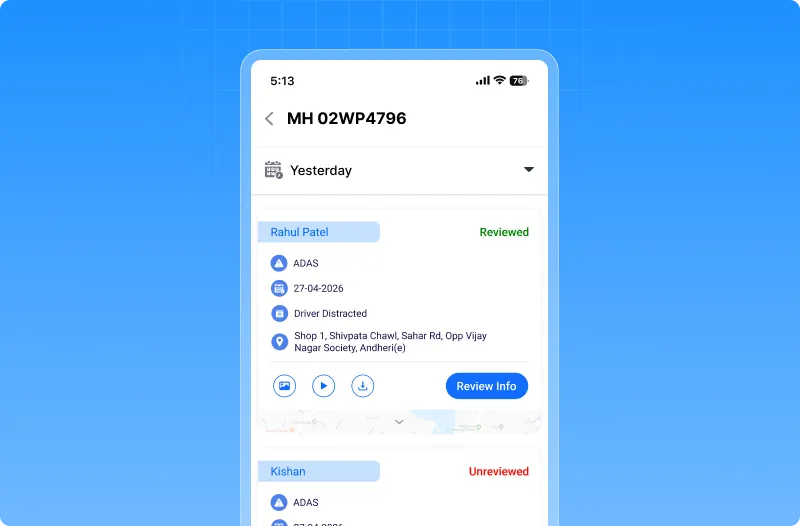
All directly within the system.
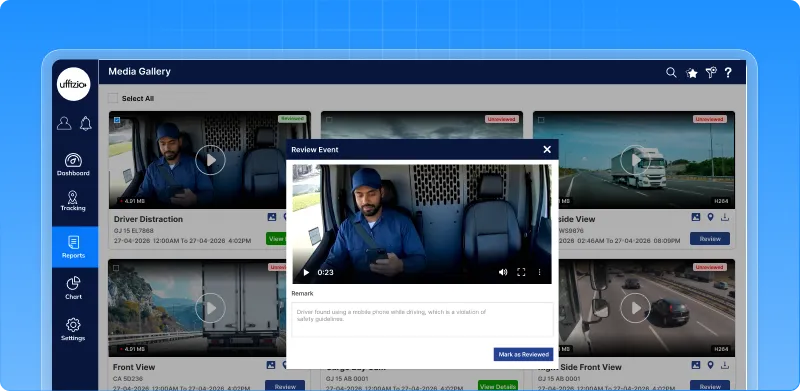
How it works
- Every new event is marked as Unreviewed by default
- Supervisor opens the video/image
- Marks it as Reviewed and adds remarks
- Status updates instantly across all reports
Why this matters
- Ensures no critical safety event is missed
- Improves accountability across teams
- Supports audits and compliance
- Helps convert raw events into actionable insights
Now, ADAS/DMS events are not just recorded they are reviewed, tracked, and acted upon.
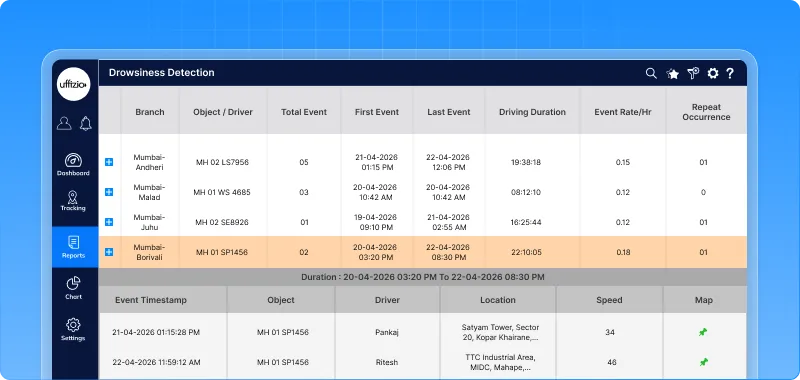
1.3 Drowsiness detection summary report
Driver drowsiness is a major safety risk but raw alerts alone don’t give the full picture.
Now, you can see it clearly.
What’s added
A new Drowsiness summary report gives a complete view of drowsiness events across your fleet. It shows:
- Total drowsiness events
- Event frequency during driving
- Repeat occurrences
- First and last event timings
With a detailed view to check each alert.
 Why this matters
- Identify high-risk drivers and vehicles
- Understand when drowsiness happens most
- Track repeated risky behavior
- Helps prevent accidents proactively
- Improves driver safety and monitoring
- Supports better planning and compliance
Now, instead of just seeing alerts you can understand and act on driver fatigue patterns.
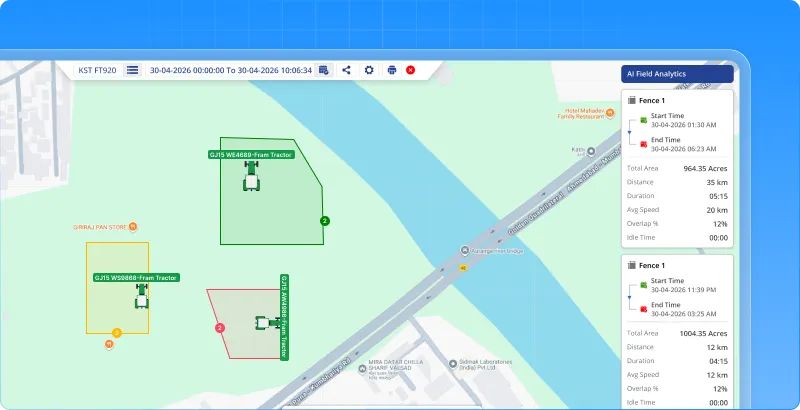
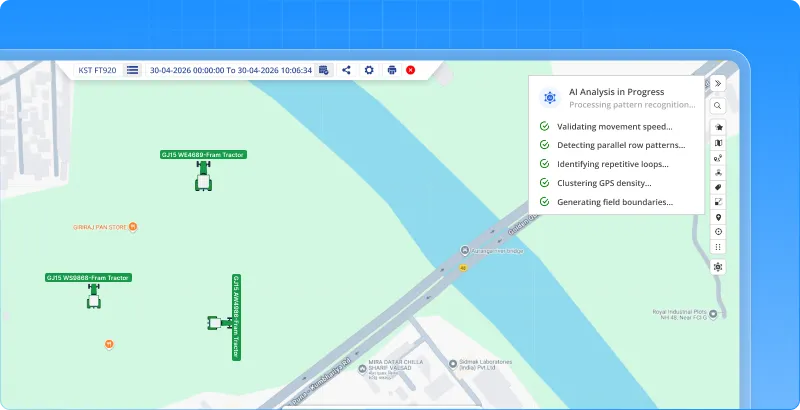
1.4 AI Field measurement on playback
Measuring field activity manually takes time and effort. You have to track movement, draw boundaries, and calculate area. Now, AI does it for you.
What’s New
A new AI field measurement option is added in Playback. With one click, the system:
- Detects farming activity automatically
- Draws field boundaries on the map
- Calculates area, distance, and duration
All without manual input.
What this enables
- Identify cultivated or harvested fields instantly
- Get field-wise analytics like:
- Area covered
- Distance travelled
- Time spent
- View multiple fields separately in one playback
 Why this matters
- Eliminates manual field measurement
- Saves time and effort
- Improves accuracy of farm operations
- Helps in better planning and reporting
Now, instead of measuring fields manually you can analyze them instantly with AI.
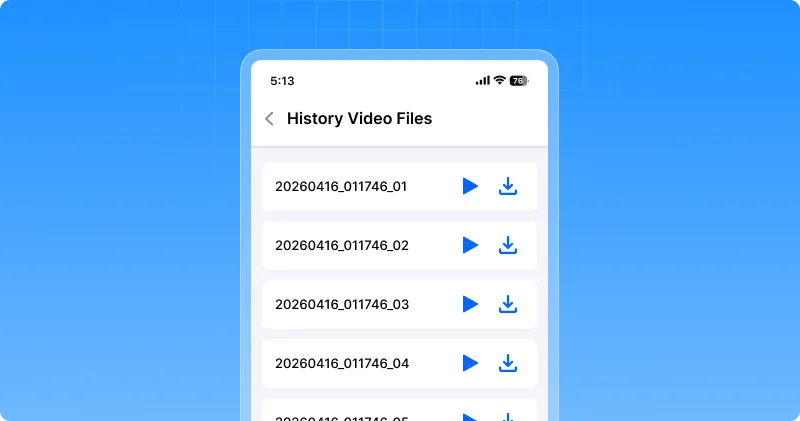
1.5 Video history now available for cv200 on mobile
Earlier, video history for CV200 devices was available only on the web. This made it difficult for users who rely on mobile for monitoring. Now, it’s available on mobile too.
Whats updated
You can now view video history of CV200 devices directly in the mobile app. The experience follows the same familiar design used for other devices.
What this enables
- Access past video footage anytime from mobile
- No need to switch to web for playback
- Consistent experience across devices
 Why this matters
- Improves on-the-go monitoring
- Saves time and effort
- Makes video access more convenient
Now, video history is not limited to web you can view it anytime, right from your mobile.
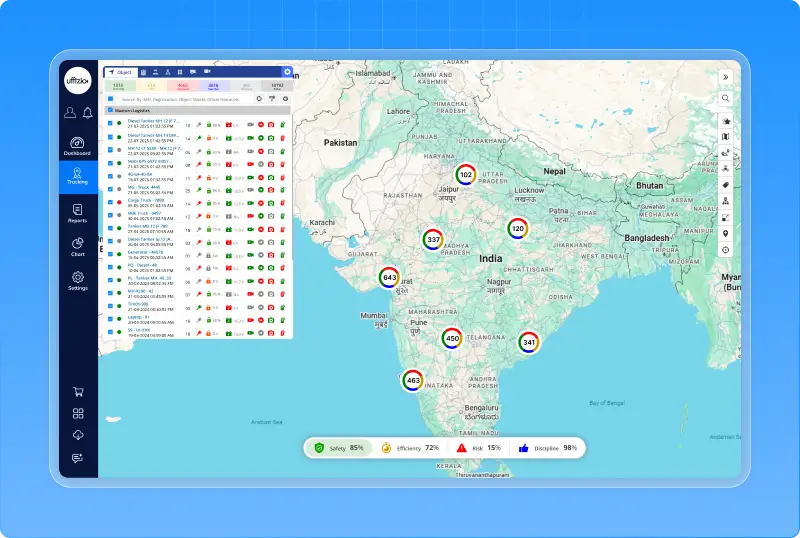
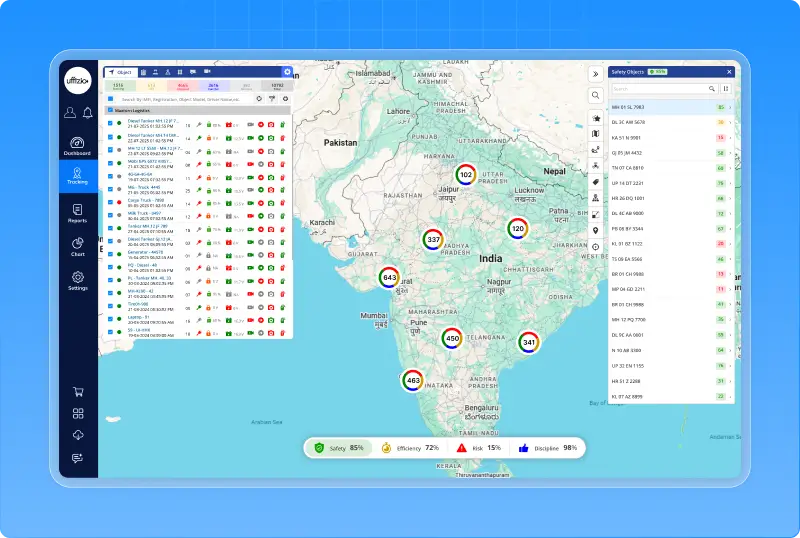
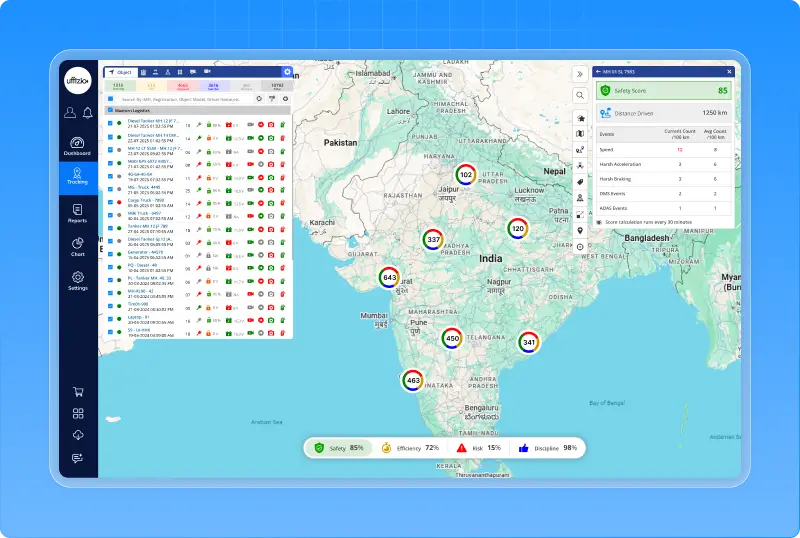
1.6 Fleet performance score bar for instant decisions from live tracking screen
Managing a fleet often means going through multiple reports to understand what’s happening. But decisions need to be fast. Now, you don’t have to search for insights, they come to you.A new AI-powered fleet intelligence score is introduced on the Live Tracking screen. In one view, you get:
- Safety score
- Efficiency score
- Risk score
- Discipline score
All calculated automatically using real fleet data.
What makes this powerful
This is not just a score it’s a complete decision-making layer. Each score is built using:
- Driving behavior
- Vehicle usage patterns
- ADAS/DMS events
- Operational discipline
And updated continuously based on real activity.
What you can do instantly
- Identify risky or unsafe vehicles
- Spot inefficient operations
- Compare performance across vehicles
- Take action without opening multiple reports
Why this matters
- One screen for complete fleet understanding
- Faster and smarter decisions
- Improved safety and efficiency
- Better control over operations
Now, Live Tracking is not just about location it becomes your control center for fleet intelligence.
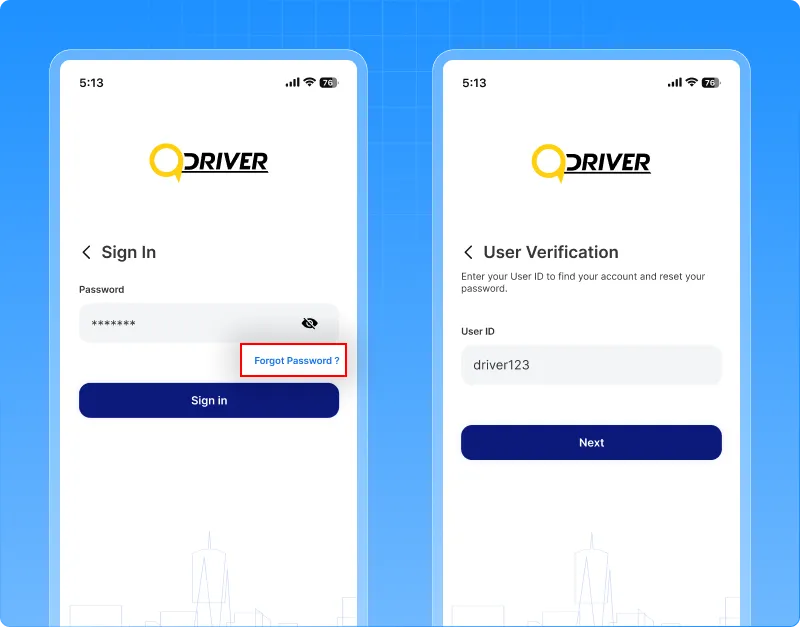
1.7 Drivers can now reset password instantly
Drivers often forget passwords, especially in daily operations. Earlier, they had to depend on admin or support to reset it causing delays in login and work. Now, they can do it themselves.
What’s New
A Reset Password option is now available on the Driver App login screen.
Drivers can:
- Enter their User ID for verification
- Choose to receive a reset link via:
- Registered mobile number
- Registered email
- Set a new password securely
What this enables
- Quick account recovery without admin support
- Secure verification using existing user details
- Smooth and guided reset experience
 Why this matters
- Reduces login delays for drivers
- Minimizes dependency on support teams
- Ensures secure and hassle-free access
Now, drivers can reset their password anytime quickly and securely.
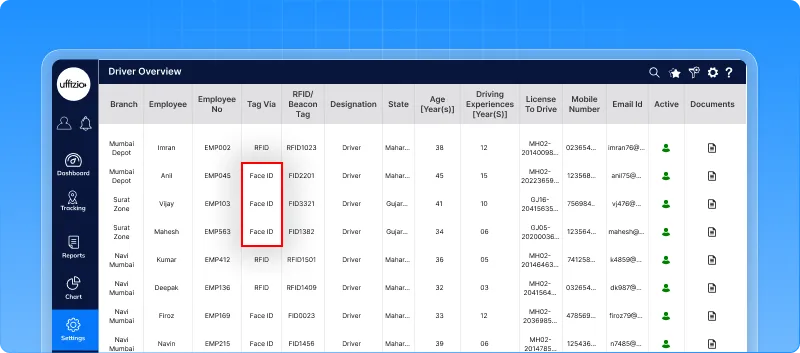
1.8 From tags to faceID: A smarter identification approach
Driver identification has always depended on something external a card, a tag, or a device. This creates dependency, delays, and chances of misuse. Now, identification becomes effortless and more reliable.Introducing FaceID as a new way to identify drivers. Drivers can now be recognized instantly using FaceID without relying on RFID or iButton. It works seamlessly across:
- Live Tracking
- Reports
- Alerts
What this changes
- No more lost or shared tags
- No manual identification steps
- Accurate, real-time driver mapping
Everything becomes faster and more dependable.
 Why this matters
- Stronger driver accountability
- Higher security and authenticity
- A modern and scalable identification system
This is not just an upgrade it’s a move towards frictionless and smarter fleet operations.
2. Smartwaste Updates
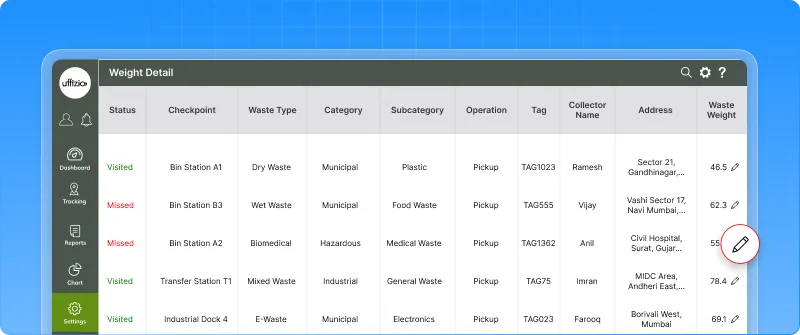
2.1 Secure weight editing with role-based access
In daily operations, weight is entered on the field. But sometimes, mistakes happen and earlier, there was no way to correct them. This led to inaccurate reports and confusion. Now, corrections can be done with control.
What’s updated
A rights-based weight edit option is introduced for collection addresses.
Authorized users can now:
- Edit weight entries directly from the system
- Make corrections at the job record level
- Update only valid (visited) records
What this enables
- Fix incorrect weight entries easily
- Maintain accurate job and report data
- Ensure edits are done only by authorized users
 Why this matters
- Improves data accuracy for reporting and billing
- Prevents misuse with role-based control
- Reduces dependency on manual corrections
Now, weight data is not just recorded it’s accurate, controlled, and reliable.
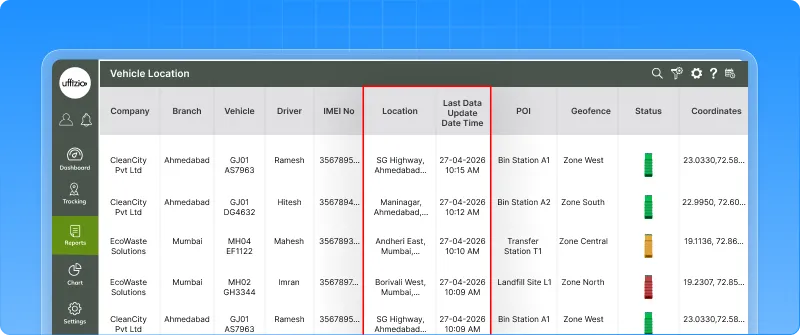
2.2 Track vehicle movement & stoppage with location status report
Understanding where vehicles were and what they were doing is critical. But earlier, this required checking multiple views or live tracking manually.
Now, it’s all available in one report.
What’s New
A new vehicle location status report is introduced in the SWM portal. It shows:
- Where vehicles were during a selected time
- Whether they were moving or stopped
- A clear timeline of activity
What this enables
- Analyze movement vs stoppage in one place
- Identify idle vehicles and long stoppages
- Understand asset utilization clearly
 Why this matters
- Helps optimize routes and reduce idle time
- Supports SLA and compliance validation
- Provides exportable proof of service
Now, instead of guessing vehicle activity you get a clear, structured view of movement and stoppage.
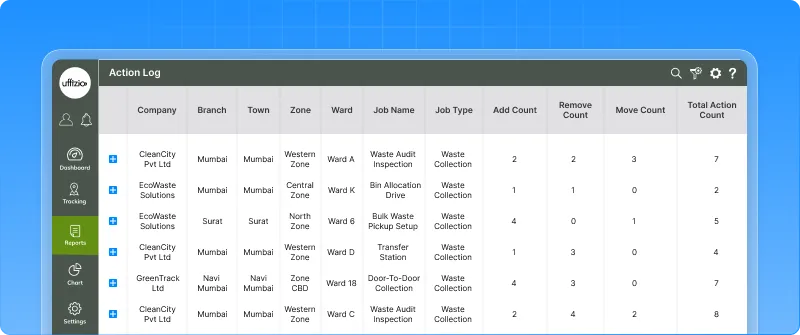
2.3 Track every action with action log report
In daily operations, collection points are constantly updated added, removed, or moved between jobs. But earlier, there was no clear way to track these changes. This made it difficult to understand:
- What changed
- Who made the change
- When it happened
Now, everything is recorded.
What’s added now
A new action log report is introduced to track all point-level actions. It captures:
- Add, Remove, and Move actions
- User details and timestamps
- Job mapping for each change
All in a structured, report format.
What this enables
- Full visibility of all collection point changes
- Clear audit trail for every action
- Easy drill-down from summary to detailed logs
 Why this matters
- Improves accountability across teams
- Helps validate operational changes
- Supports audits and compliance checks
Now, every action is not just performed it’s tracked, visible, and accountable.
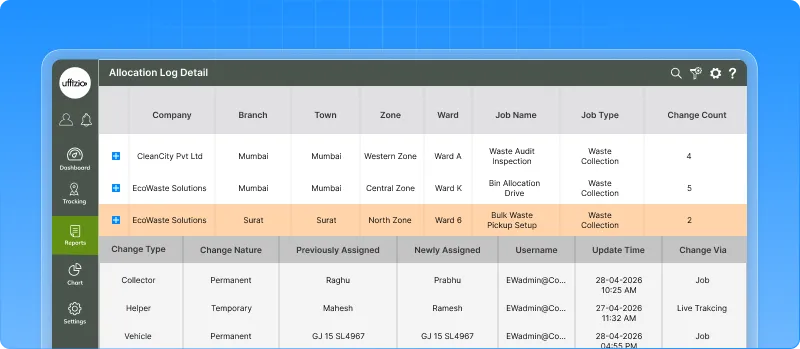
2.4 Track allocation changes with allocation log report
In daily operations, vehicles, collectors, and helpers are frequently reassigned. But earlier, there was no clear way to track these changes. This made it difficult to know:
- What was changed
- Who made the change
- What the previous assignment was
Now, everything is logged.
What’s updated
A new allocation log report is introduced to track all assignment changes. It captures:
- Vehicle, collector, and helper changes
- Previous vs new assignments
- User and timestamp details
All in a structured, filterable report.
What this enables
- Full visibility of allocation changes
- Easy tracking of who updated what
- Drill-down from summary to detailed logs
 Why this matters
- Improves operational transparency
- Helps in resolving disputes quickly
- Strengthens accountability across teams
Now, allocation changes are not just made they are tracked, visible, and fully auditable.
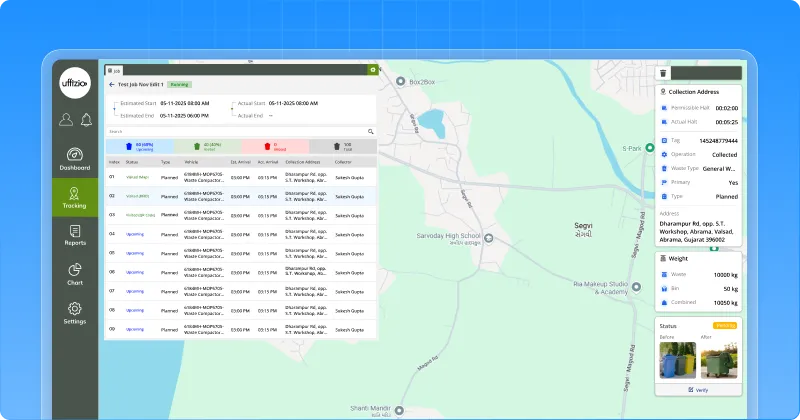
2.5 Customize job view directly from live tracking
While monitoring jobs, supervisors often need to adjust what they see. Earlier, this meant navigating to separate settings pages. It slowed down operations. Now, customization is right where you need it.
What’s changed
A settings button is added on the live tracking job detail screen. Supervisors can:
- Customize visible fields
- Adjust view preferences
- Configure the screen instantly
All without leaving the page.
What this enables
- On-the-spot customization during operations
- Fewer clicks and faster adjustments
- More control over how job data is viewed
![]() Why this matters
Why this matters
- Saves time during live monitoring
- Improves usability for control room teams
- Makes the system more flexible and user-friendly
Now, instead of adapting to the screen the screen adapts to you.
2.6 Ensure accurate reporting with image verification
In waste collection, before/after images are important proof. But earlier, all uploaded images were treated as valid with no verification. This could lead to incorrect reporting and missed issues. Now, every image can be verified.
What’s changed
A before/after image verification workflow is introduced. Authorized users can now:
- Approve or reject images
- Verify images directly from live tracking or playback
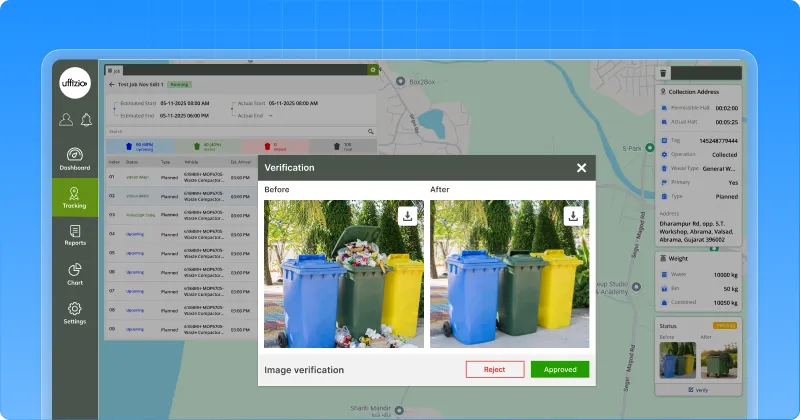
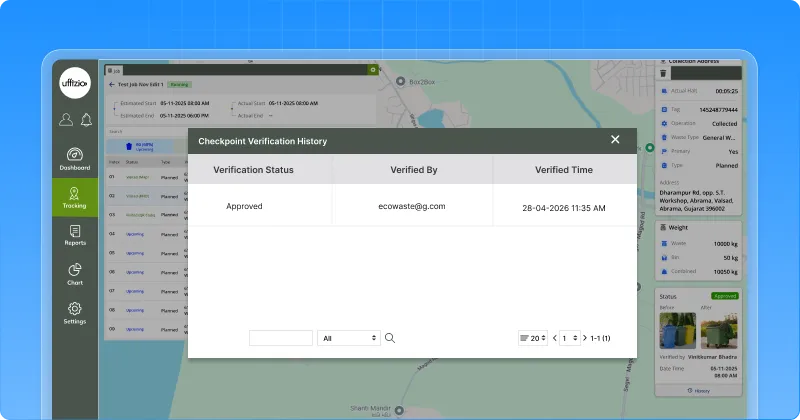
- Track who verified and when
 What this enables
- Only verified images are considered valid
- Clear visibility of pending, approved, and rejected checkpoints
- Collectors are notified to revisit if images are rejected
Why this matters
- Improves data accuracy and reporting reliability
- Ensures proper validation of field work
- Adds accountability with a clear audit trail
Now, images are not just uploaded they are verified, trusted, and actionable.
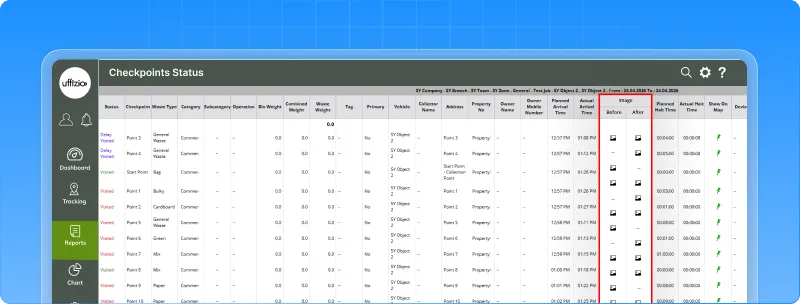
2.7 View & download before–after service proof in one report
In waste management, showing work done is just as important as doing it. But earlier, before/after images were scattered making it difficult to present clear proof. Now, everything comes together in one place.
What’s updated
A dedicated before after image report screen is introduced. You can:
- View service images in a structured format
- Filter by job, date, zone, ward, and more
- Download a consolidated report in one click
What this enables
- Access all before/after images in a single report
- Share visual proof of service easily
- Customize reports with or without owner details
 Why this matters
- Provides clear proof of cleanliness and service quality
- Supports Smart City and Swachh Bharat KPIs
- Reduces manual effort of collecting and sharing images
Now, service quality is not just tracked it’s clearly visible, organized, and easy to share.
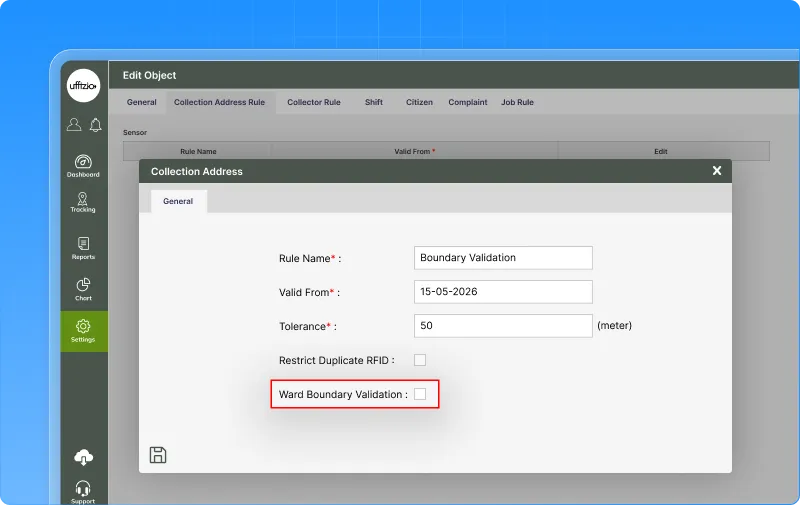
2.8 Ensure correct mapping with ward boundary validation
While adding collection or survey points, location accuracy is critical. But earlier, points could be added outside the actual ward area leading to incorrect data and reporting issues. Now, this is controlled.
What’s New
A ward boundary validation rule is introduced during point creation. When enabled, the system:
- Checks if the point lies within the ward boundary
- Prevents saving points outside the defined area
- Shows a clear validation message
What this enables
- Accurate ward-wise mapping of collection points
- Prevention of incorrect data entry at the source
- Flexibility to enable or disable validation as needed
 Why this matters
- Improves data accuracy and reporting
- Reduces manual corrections later
- Ensures reliable ward-level insights
Now, collection points are not just added they are validated, accurate, and correctly mapped.
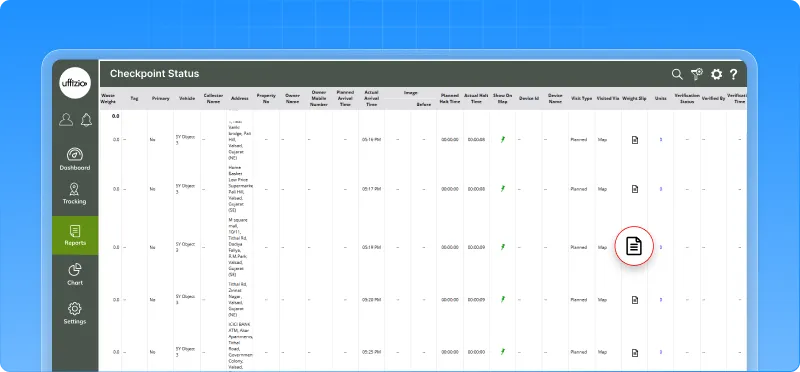
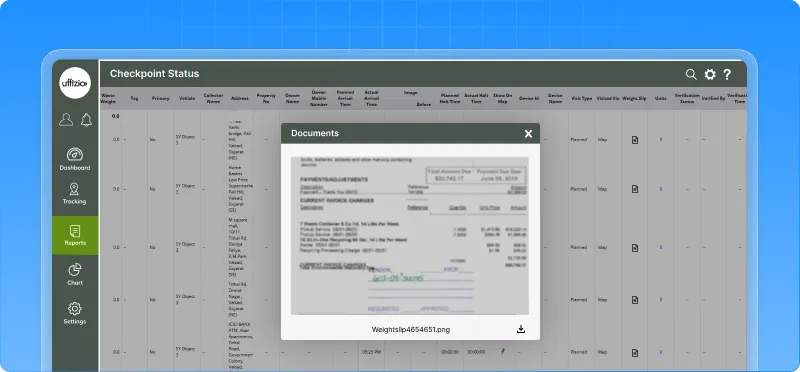
2.9 Add proof to weight data with slip visibility
Collectors upload weight slips during operations but earlier, these images were not visible to supervisors. This created a gap in verification. Now, weight slips are accessible.
What’s New
A new weight slip column is added in the job detail summary report. You can now:
- View uploaded weight slip images
- Open them directly from the report
- Verify entries with actual proof
What this enables
- Easy verification of weight data
- Direct access to proof of collection
- Better visibility for supervisors and admins
Why this matters
- Improves transparency in operations
- Supports audits and validation
- Connects field data with report-level review
Now, weight data is not just numbers it’s backed by visible proof.
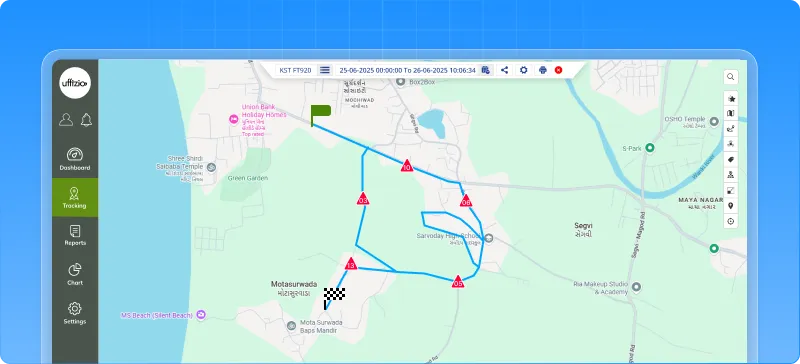
2.10 See where vehicles actually stopped with playback-based collection mapping
In operations, it’s not enough to know where a vehicle passed what matters is where it actually stopped. Earlier, this visibility was missing. Now, you can see the real picture.
What’s New
Playback is enhanced to map actual vehicle stoppages to collection addresses. This means:
- Real stoppage points are identified from GPS data
- These points are linked to collection activity
- You can clearly see where service actually happened
What this enables
- Verify if vehicles stopped at the correct locations
- Identify missed or partially serviced areas
- Get real, data-backed visibility of operations
Why this matters
- Reduces disputes with clear proof of stoppage
- Improves service quality and route planning
- Strengthens audit and SLA compliance
Now, it’s not just about where vehicles moved it’s about where the work actually happened.
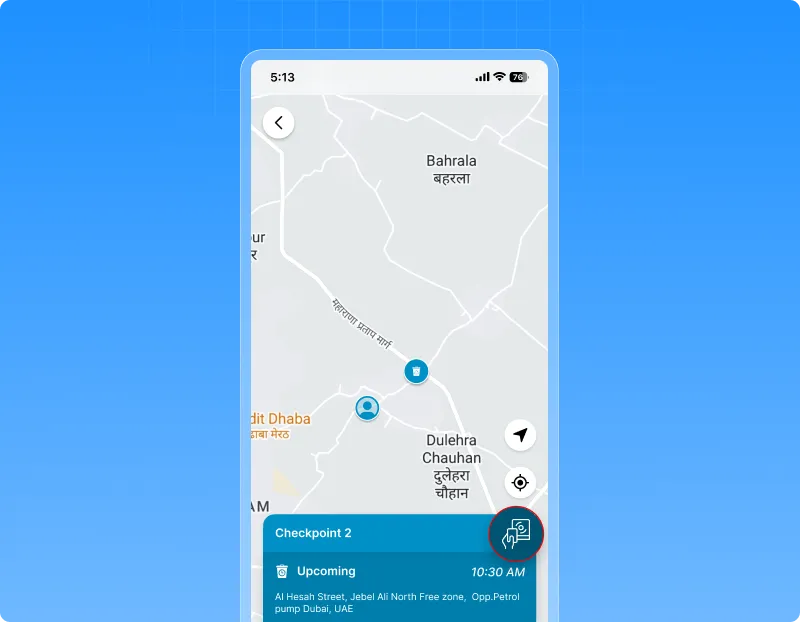
2.11 Ensure checkpoint coverage in hard-to-reach areas
In real operations, GPS or RFID doesn’t always work perfectly. But earlier, if a visit wasn’t detected automatically, it was marked as missed even if the work was done. Now, that gap is covered.
What’s New
The system now supports manual visit marking for checkpoints. Collectors can:
- Mark a checkpoint as visited manually
- Capture GPS location and timestamp
- Ensure the visit is recorded correctly
Even when automatic detection fails.
What this enables
- Capture valid visits even in low connectivity or GPS issues
- Ensure accurate checkpoint visit history
- Reduce dependency on perfect device conditions
Why this matters
- Prevents valid work from being marked as missed
- Improves SLA tracking and reporting accuracy
- Makes the system more reliable in real-world conditions
Now, visits are not missed due to technical issues they are captured accurately, no matter the conditions.
3. Gridzee updates
3.1 Monitor indoor conditions in real time with sensor-based tracking
In indoor environments like cold storage or warehouses, it’s not just about where assets are it’s about the conditions inside each area. Now, you can monitor both in one place.
What’s updated
Live tracking is enhanced to show real-time temperature and h umidity data from sensors installed in rooms or zones.You can now:
- View area-wise climate data directly in the tracking list
- Identify abnormal conditions with color-coded indicators
- See live readings on the indoor map for each location
- Access a dedicated Environmental tab for focused monitoring
What this enables
- Real-time monitoring of temperature and humidity across zones
- Quick identification of critical environmental changes
- Easy tracking of sensor data without switching modules
- Better control over climate-sensitive areas
![]() Why this matters
Why this matters
- Prevents spoilage in cold storage and sensitive environments
- Enables faster action during temperature or humidity deviations
- Combines location visibility with environmental awareness
Now, indoor tracking is not just about movement it’s about maintaining the right conditions in every space.
3.2 Smarter indoor tracking with barrier-aware movement
In indoor spaces, movement is not always open. There are walls, restricted zones, and physical barriers but earlier, tracking didn’t always reflect that. Now, it does.
What’s updated
Live tracking and playback are enhanced to respect floor barriers while plotting tag movement. This means:
- Movement paths no longer cross walls or restricted areas
- Tag positions are mapped based on actual accessible paths
- Playback shows realistic movement within defined zones
What this enables
- More accurate indoor positioning
- Realistic movement tracking inside facilities
- Better understanding of how assets or people move
![]() Why this matters
Why this matters
- Improves trust in indoor tracking data
- Helps in layout-based analysis and planning
- Ensures tracking aligns with real-world floor structure
Now, tracking doesn’t just show movement it shows movement as it actually happens in your space.
Conclusion
Together, these updates reflect our commitment to continuous innovation and operational excellence. By aligning every improvement with real user needs, we are shaping a platform that not only performs better but also works smarter for you. The journey doesn’t stop here—this is just the next milestone.