
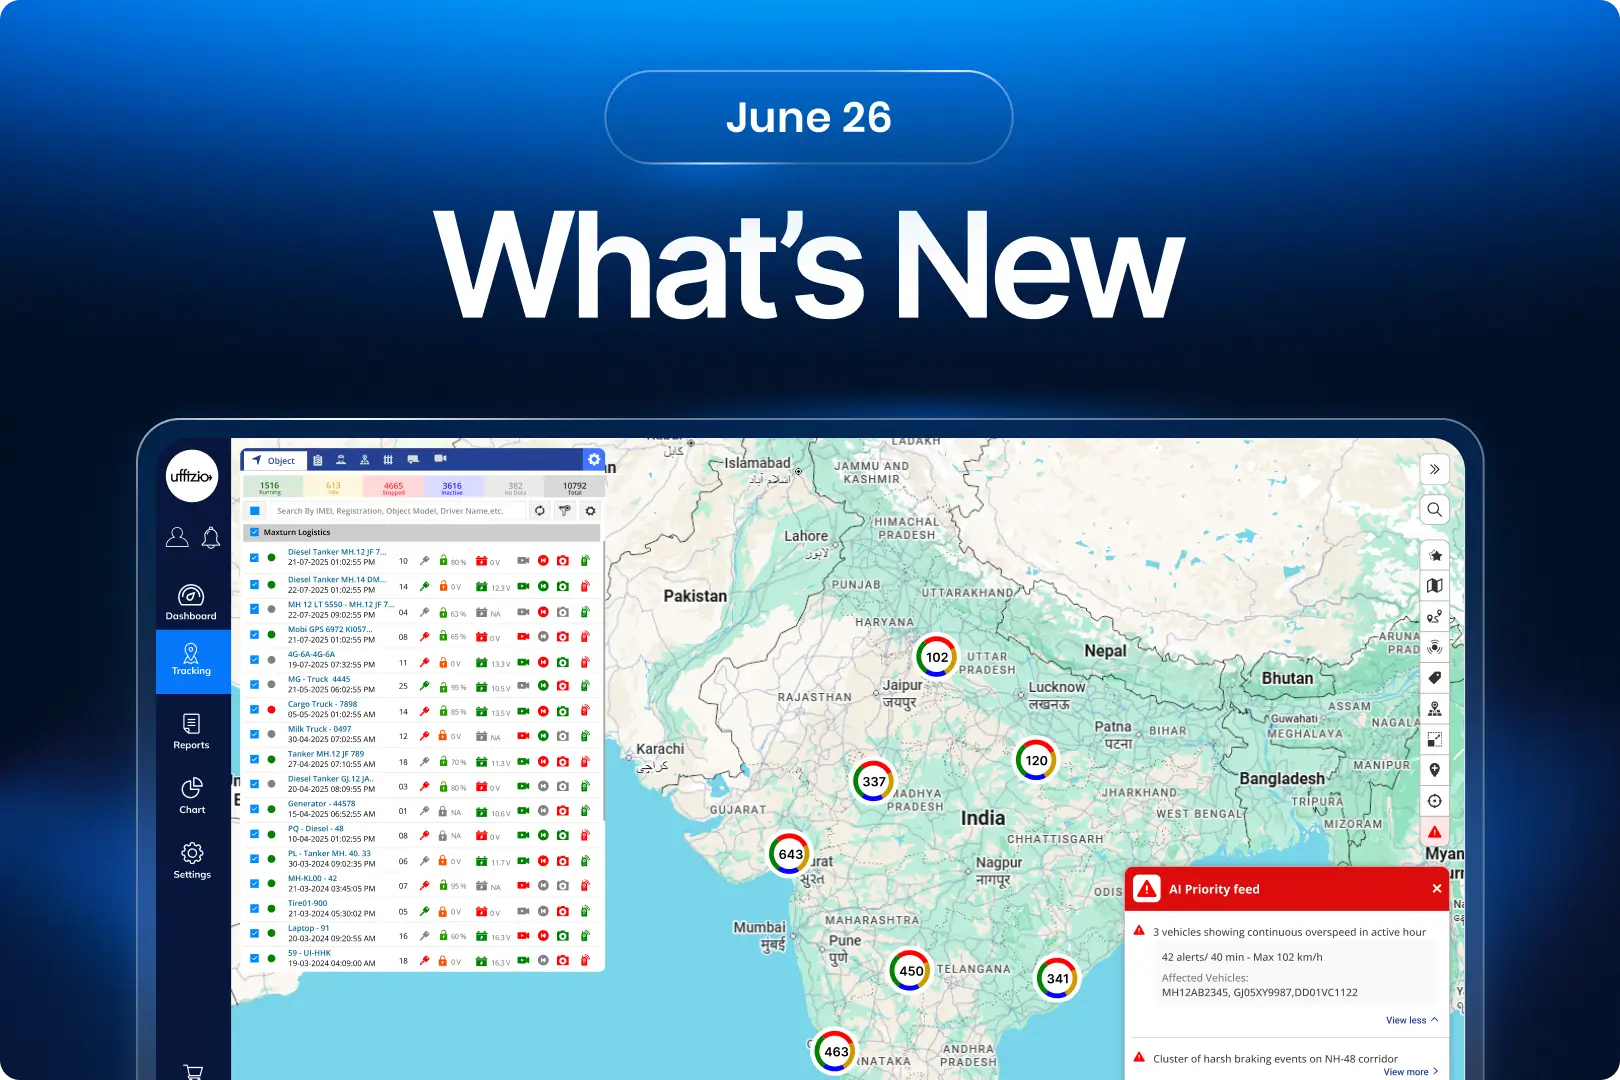
Great products evolve with the people who use them.
That’s why every month’s release is built around customer feedback, practical business challenges, and opportunities to improve day-to-day operations. This edition brings together a range of enhancements across our solutions, helping users save time, gain better insights, and manage their operations more efficiently with smarter, more intuitive tools.
1.Trakzee updates
1.1 Bringing maps and video together in one playback
Reviewing an incident often means switching between two different views one showing the vehicle’s route on the map and another showing the recorded video. While both provide valuable information, understanding exactly where an event happened and what happened at that moment requires constant back-and-forth, making investigations slower and less efficient.
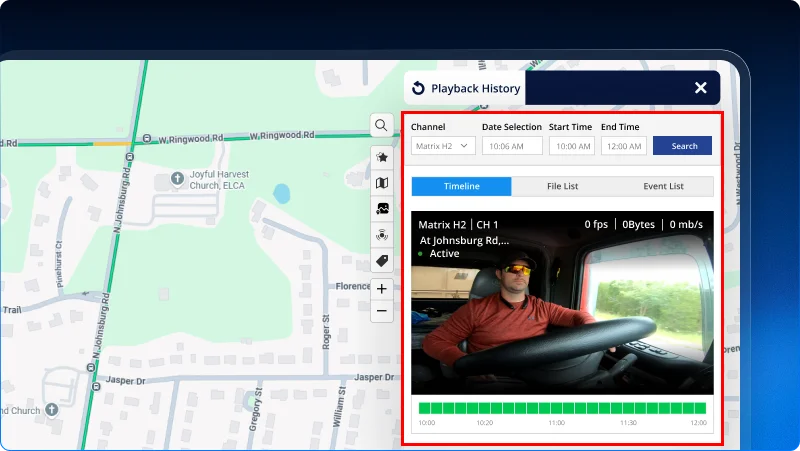
To make playback more intuitive, Trakzee now synchronizes video playback with vehicle movement and telemetry, giving users a complete view of every journey from a single screen.
What’s updated
History Playback Video now works alongside the Live Tracking map.
When a playback session starts, Trakzee automatically loads the vehicle’s historical route and telemetry for the selected time period. As the video plays, the vehicle marker moves along the route in real time while speed, ignition status, and other telemetry values update in sync with the playback timeline.
Whether playback is started from the Vehicle tab or the Video tab, both entry points now provide the same synchronized experience.
Key benefits
- Watch vehicle movement and video together in a single playback.
- See telemetry values update alongside the video timeline.
- Fast-forward, rewind, pause, and resume with synchronized map movement.
- Investigate incidents with complete operational context.
Business impact
Understanding an incident shouldn’t require piecing together information from multiple screens. By combining historical video, vehicle movement, and telemetry into one synchronized playback, fleet managers can investigate events faster, verify driver behaviour more accurately, and make better operational decisions. For system integrators, this enhancement delivers a richer video telematics experience that adds significant value for safety, compliance, and incident management.
“Now, every playback shows not just what happened but exactly where and when it happened.”
1.2 Switch views without interrupting live streaming
When monitoring live video, switching between different viewing layouts should feel effortless. Whether moving from Map + Video to Matrix view or back again, users expect the stream to continue without interruption just like it does on today’s leading streaming platforms.
Previously, changing the view briefly restarted the video player, resulting in a blank screen before the stream resumed. While the interruption lasted only a few seconds, it affected the overall monitoring experience.
What’s updated
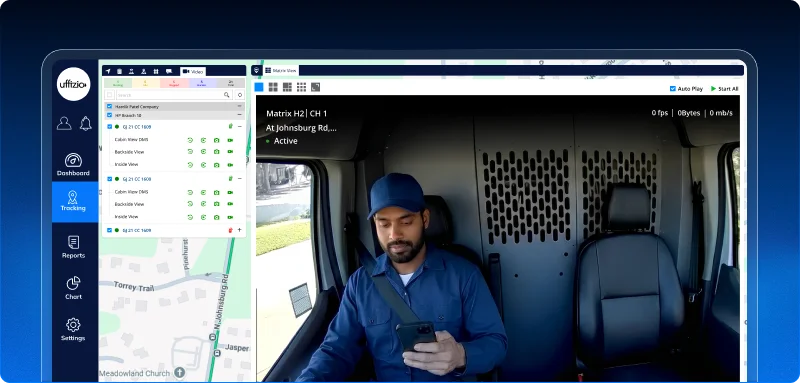
Trakzee now uses a shared video player when switching between Map + Video and Matrix views.
Instead of reloading the stream, the active video session is maintained throughout the transition, allowing users to continue watching without blank screens or playback interruptions.
Key benefits
- Eliminate blank screens while changing views.
- Enjoy seamless, uninterrupted live streaming.
- Experience faster and smoother view transitions.
- Reduce playback delays by avoiding player reinitialization.
Business impact
Continuous visibility is essential during live fleet monitoring. By maintaining a single streaming session across different layouts, Trakzee delivers a smoother and more responsive video monitoring experience, helping operators stay focused on real-time events without unnecessary interruptions.
“Now, switching views feels as seamless as switching videos on your favorite streaming platform.”
1.3 Spot high-risk vehicles instantly on the live map
When managing hundreds or even thousands of vehicles, it’s not always easy to identify which ones need immediate attention. Even though risk scores are available, operators often have to open individual vehicle details before they can understand which vehicles are classified as high risk.
To make fleet monitoring more proactive, Trakzee now brings risk intelligence directly onto the live tracking map.
What’s added
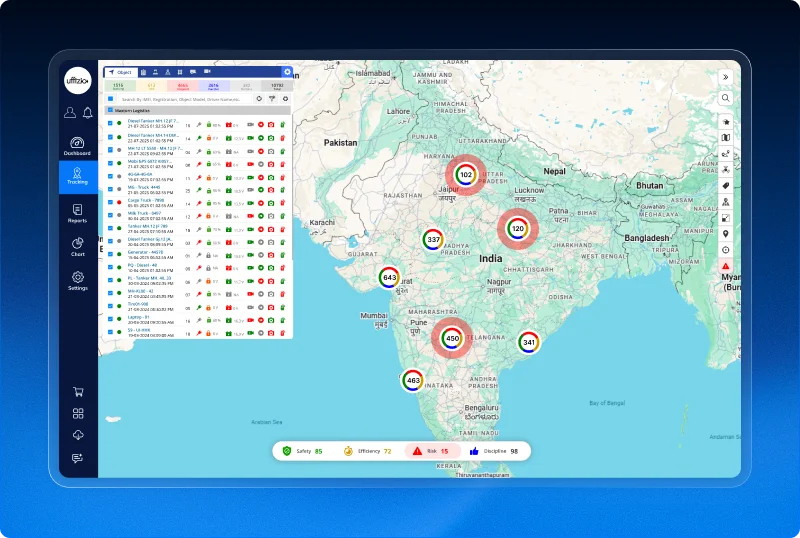
A new risk layer has been introduced in live tracking, making high-risk vehicles and clusters instantly visible on both the web platform and mobile application.
When enabled, clusters containing high-risk vehicles are visually highlighted, while individual high-risk vehicles remain clearly distinguishable as users zoom into the map. Clicking a highlighted vehicle displays its existing Performance Score along with Risk Insights, helping operators quickly understand why the vehicle has been classified as high risk.
The risk layer is enabled by default and can be turned on or off anytime through the map settings based on user preference.
Key benefits
- Identify high-risk vehicles without opening individual records.
- Instantly recognize clusters containing risky vehicles.
- Access risk insights directly from the live tracking map.
- Enable or disable the Risk Layer whenever needed.
- Improve response time by focusing on vehicles that need immediate attention.
Business impact
Fleet operators can only respond quickly when they know where to focus. By visualizing risk directly on the map, Trakzee helps teams prioritize high-risk vehicles in real time instead of searching through large fleets manually. For system integrators, this enhancement adds another intelligent decision-making layer to live tracking, enabling customers to improve safety, operational awareness, and fleet performance.
“Because the fastest way to reduce risk is to make it impossible to miss.”
1.4 Introducing AI priority feed for smarter fleet monitoring
Managing a fleet means dealing with a constant stream of alerts. Overspeeding, harsh braking, geofence violations, and other events can quickly add up, making it difficult to identify which situations need immediate attention. When everything looks important, the truly critical issues can easily be overlooked.
That’s where AI steps in.
What’s added
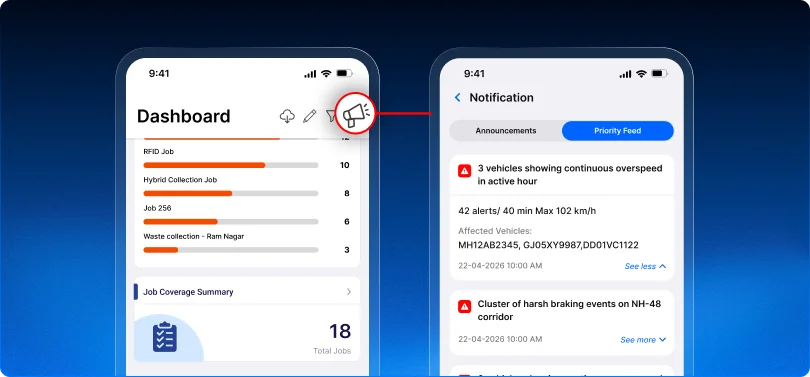
Trakzee now introduces an AI priority feed that automatically analyzes alerts from the past hour and highlights the three most important events requiring attention.
Instead of displaying every alert equally, the system groups related events, evaluates their severity and frequency, and uses AI to generate short, easy-to-understand summaries. Fleet managers can instantly see what demands their attention, while a View More option provides deeper insights, including affected vehicles, alert counts, and event details.
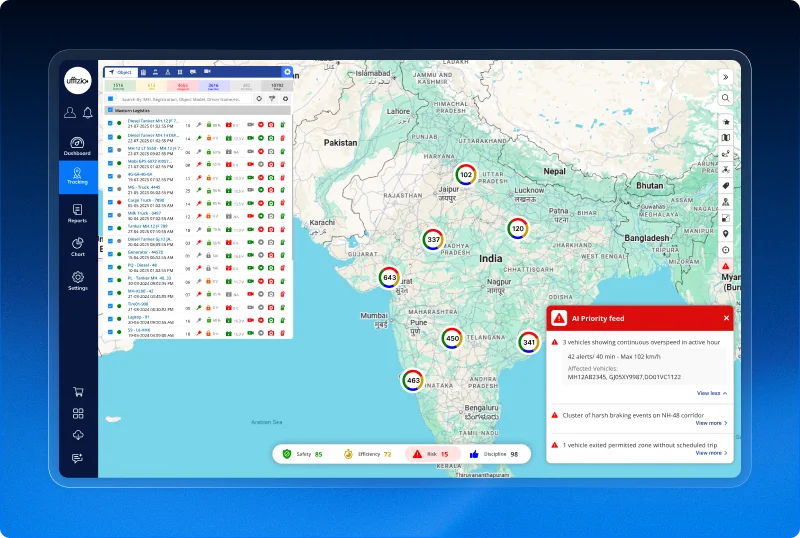
The AI Priority Feed is available on both the web platform and mobile application, ensuring critical updates remain accessible wherever users are working.
Key benefits
- Automatically identify the most critical fleet events.
- Reduce alert fatigue by filtering out unnecessary noise.
- Receive AI-generated summaries that are easy to understand.
- Drill down into detailed vehicle and alert information when needed.
- Stay informed through live notifications on both web and mobile.
Business impact
Fleet operators shouldn’t have to spend valuable time deciding which alerts deserve attention first. By combining intelligent filtering with AI-powered prioritization, Trakzee transforms hundreds of operational alerts into a small set of meaningful insights. This enables faster decision-making, quicker incident response, and more efficient fleet monitoring especially for organizations managing large fleets across multiple locations.
“Because the smartest fleet managers don’t need more alerts they need the right ones.”
1.5 Introducing fleet performance scores
Managing a fleet isn’t just about knowing where vehicles are it’s about understanding how they’re performing. Are drivers following safe practices? Is fuel being used efficiently? Are vehicles operating within company policies? Until now, answering these questions meant reviewing multiple reports and dashboards.
With Fleet Performance Scores, Trakzee brings all of these insights together into one easy-to-understand view.
What’s added
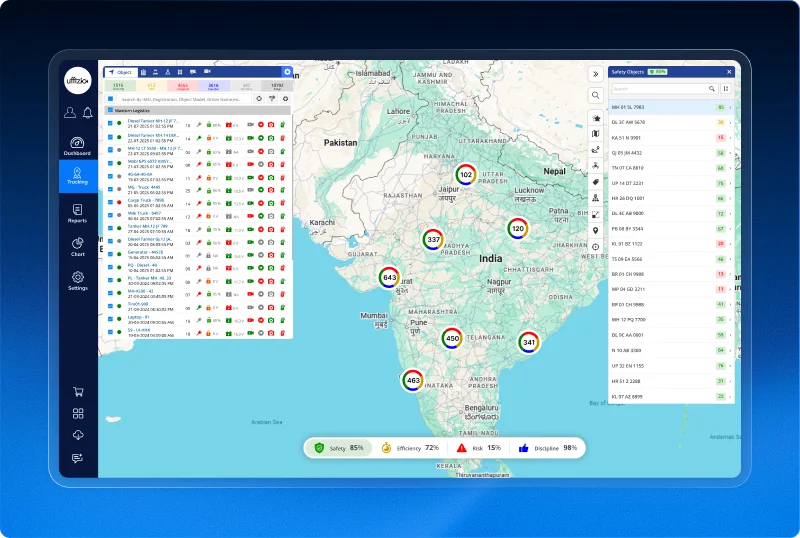
A new fleet performance score bar has been introduced in live tracking, displaying four key performance indicators:
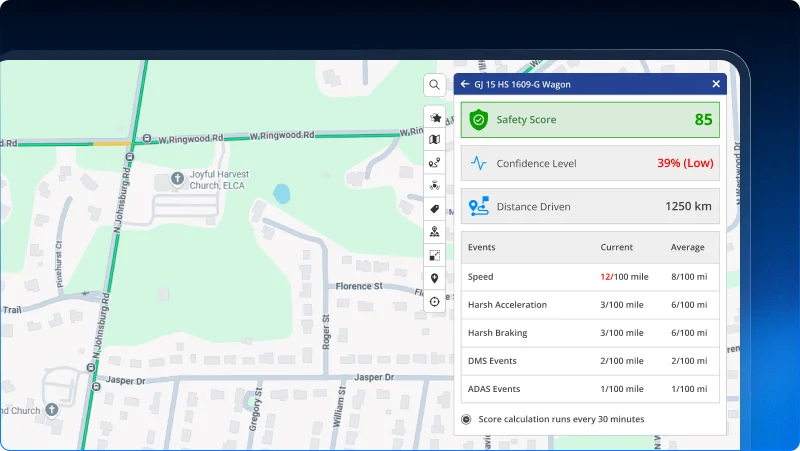
- Safety Score – Measures driving behaviour based on events such as overspeeding, harsh braking, harsh acceleration, and ADAS/DMS events.
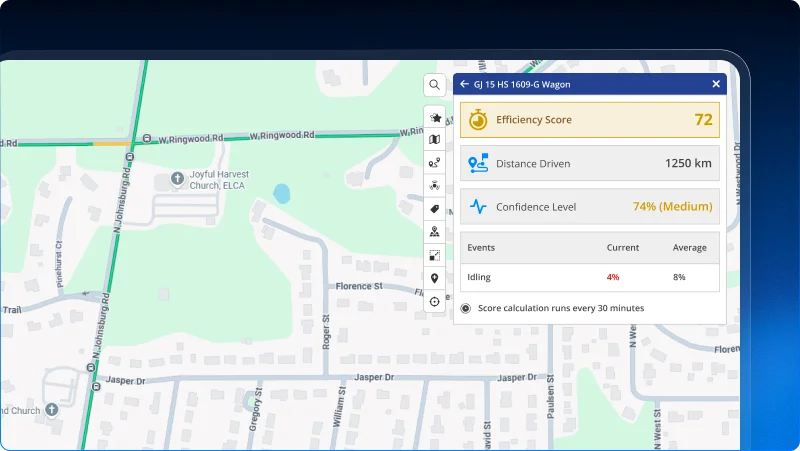
- Efficiency Score – Evaluates vehicle efficiency using engine idle behaviour and operational performance.
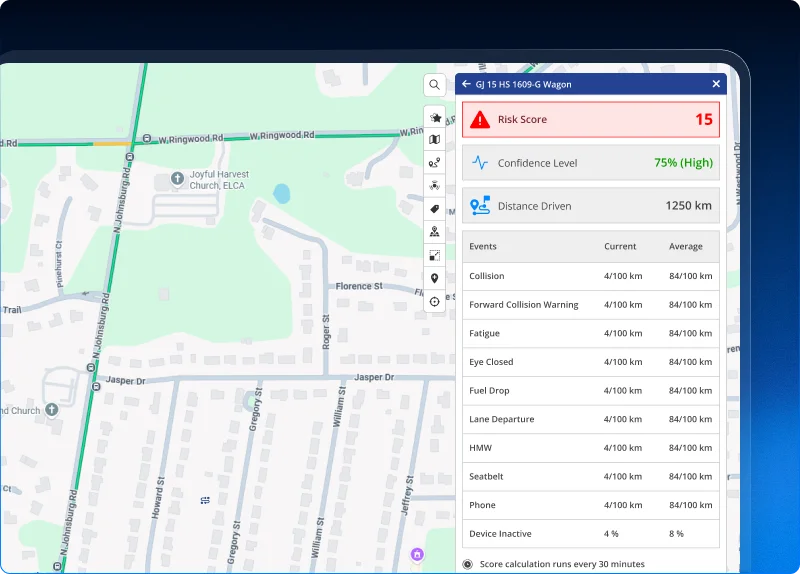
- Risk Score – Highlights the likelihood of unsafe driving or vehicle misuse by analysing behavioural and safety-related events.
- Discipline Score – Measures how well vehicles comply with operational rules such as route adherence, geofence usage, and scheduled operations.
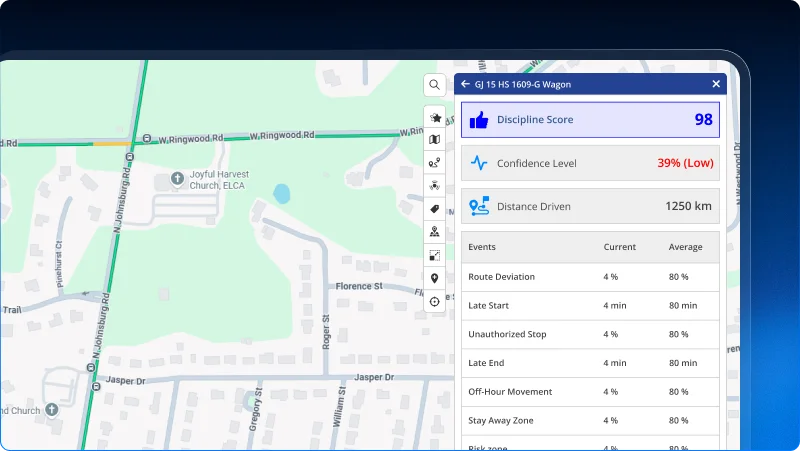
Each score is interactive, allowing users to drill down from fleet-level performance to individual vehicle details, understand the events affecting the score, and identify opportunities for improvement. Scores are automatically updated using recent operational data and are available across both the web platform and mobile application.
Key benefits
- Monitor overall fleet performance from a single score bar.
- Measure safety, efficiency, risk, and operational discipline separately.
- Drill down from fleet scores to individual vehicle insights.
- Identify performance issues before they impact operations.
- Make data-driven decisions using standardized performance metrics.
Business impact
Fleet performance scores transform thousands of telemetry events into meaningful business insights. Instead of analysing multiple reports, fleet managers can instantly understand the overall health of their fleet, identify underperforming vehicles, and take proactive action to improve safety, fuel efficiency, compliance, and operational performance. For system integrators, this provides a powerful value-added feature that helps customers measure fleet performance in a simple, consistent, and actionable way.
Because the best fleet decisions begin with knowing exactly how your fleet is performing.
1.6 Making vehicle inspections easier with visual inspection icons
Every day, drivers perform vehicle inspections before heading out on the road. It’s a simple but important task that helps fleets identify issues before they turn into costly breakdowns or safety risks.
But in reality, not every driver is comfortable working with text-heavy inspection forms. Some may struggle to read lengthy descriptions, while others may speak different languages. When inspections depend only on written text, there’s always a chance that an inspection point is misunderstood or skipped altogether.
To make the process easier for every driver, we’ve made DVIR inspections more visual and easier to understand.
What’s updated
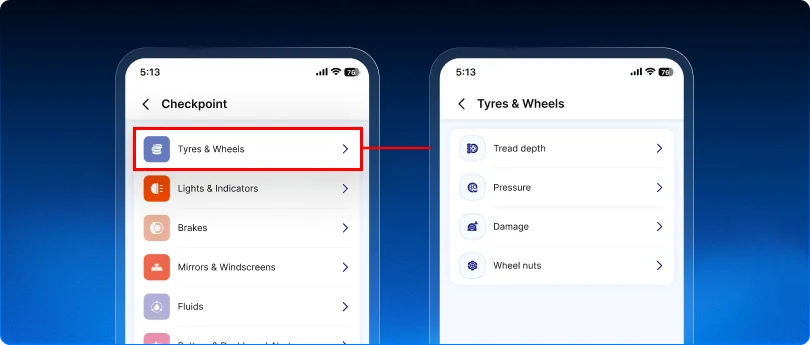
The driver vehicle inspection report (DVIR) module now displays dedicated icons for both checkpoints and sub-checkpoints in the driver mobile application.
Instead of relying only on text, drivers can quickly recognize inspection items through clear visual icons and select the appropriate response with greater confidence.
The same icons are also reflected in DVIR reports across the web application, mobile application, and downloaded reports. This allows fleet managers and supervisors to instantly understand which inspection items were selected, making report reviews quicker and more consistent.
Key benefits
- Makes vehicle inspections easier for drivers with different literacy levels.
- Helps drivers identify inspection items faster using visual cues.
- Reduces the chances of incorrect or missed inspection responses.
- Gives managers a clearer and more consistent way to review inspection reports.
Business impact
A vehicle inspection process should work for every driver—not just those who are comfortable reading detailed forms. By introducing visual inspection icons, fleets can improve inspection accuracy, encourage better compliance, and reduce reporting errors. For system integrators, it’s another practical feature that demonstrates how Trakzee is designed around real-world fleet operations and the people who use it every day.
Now, every driver can complete inspections with greater confidence, and every manager can review them with greater clarity.
1.7 Managing DVIR templates in bulk, made easy
Setting up vehicle inspections for a large fleet shouldn’t mean updating every vehicle one at a time.
Earlier, DVIR templates couldn’t be assigned through Bulk Update or Bulk Insert, making fleet onboarding and configuration updates more time-consuming—especially for organizations managing hundreds of vehicles.
What’s updated
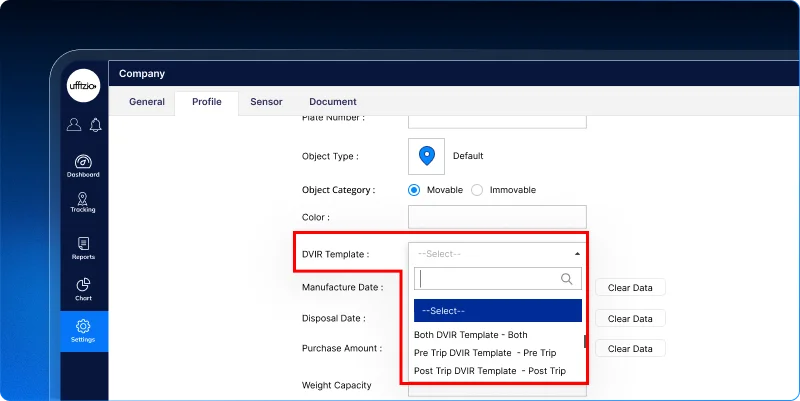
Bulk update and bulk insert now support DVIR template assignment.
Users can simply select the appropriate DVIR template from a company-level dropdown while preparing the upload sheet. The system validates every entry during upload, ensuring that only approved templates are assigned to vehicles.
Key benefits
- Assign DVIR templates to multiple vehicles in a single upload.
- Reduce manual configuration effort.
- Ensure consistent inspection templates across the fleet.
- Prevent invalid template assignments through built-in validation.
Business impact
This enhancement speeds up fleet onboarding and simplifies large-scale configuration changes. For system integrators, it reduces deployment time and helps maintain consistent inspection standards across customer fleets.
Now, configuring vehicle inspections for an entire fleet is faster, simpler, and more consistent.
1.8 Enhancing RAG scores with deeper driver insights
A driver’s performance can’t always be measured using just speed and trip data. Behaviours like overspeeding in restricted zones, seat belt usage, and the frequency of unsafe driving events also play an important role in understanding how safely a vehicle is being operated.
To help fleets build more meaningful driver scorecards, we’ve expanded the RAG configuration with additional behaviour parameters and scoring capabilities.
What’s updated
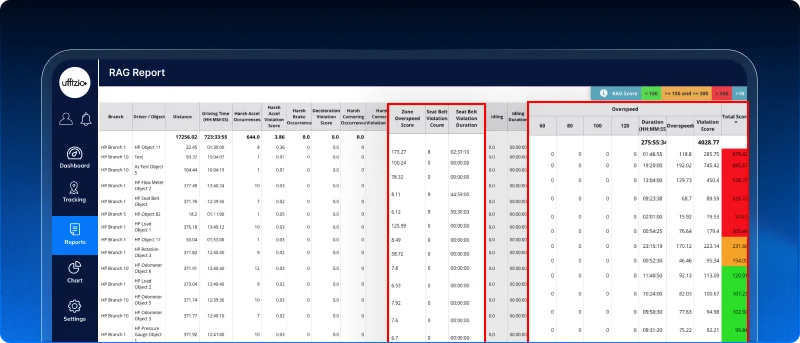
The RAG configuration now includes new driver behaviour parameters such as Over Speed Count, Zone Over Speed Count, Zone Over Speed Duration, and Seat Belt Count.
A new Zone Overspeed Score can also be configured using a custom formula, allowing organizations to define how overspeeding in specific zones should impact the overall driver score.
These updates are automatically reflected across on-screen reports, scheduled reports, and exported PDF, XLS, and CSV reports, ensuring consistent performance analysis everywhere.
Key benefits
- Measure driver behaviour using more comprehensive safety parameters.
- Configure Zone Overspeed scoring based on your organization’s policies.
- Build more meaningful and customized driver performance scorecards.
- View consistent scoring across all report formats.
Business impact
Every fleet has its own safety priorities. By giving organizations greater flexibility in how driver behaviour is measured, this enhancement helps create more relevant performance evaluations and encourages safer driving habits. It also enables system integrators to deliver a more configurable driver scoring solution that can adapt to different industries and compliance requirements.
“Now, your driver score reflects more than just driving it reflects driving behaviour where it matters most.”
1.9 Expanding fuel card integration options
Many fleet operators rely on fuel cards to monitor fuel purchases, control expenses, and simplify reconciliation. As businesses work with different fuel providers, having support for their preferred fuel card becomes essential for maintaining a smooth fuel management process.
To support more customer requirements, Trakzee continues to expand its fuel card ecosystem.
What’s added
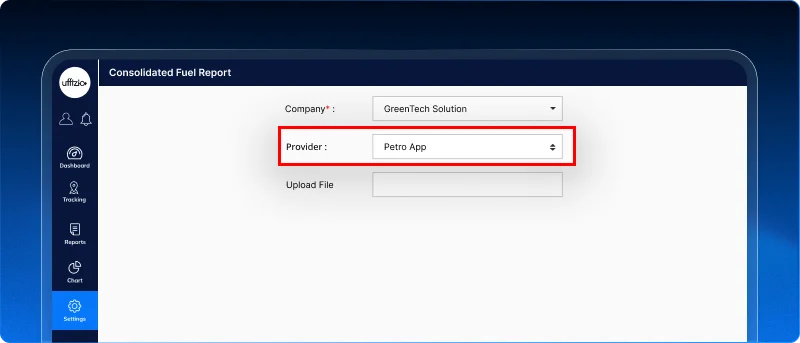
Trakzee now supports integration with the PetroApp Fuel Card provider.
Fuel transaction data from PetroApp can be imported using the supported template and processed through the existing fuel card workflow. The platform automatically parses and updates the relevant fuel data, allowing organizations to manage fuel transactions without changing their existing processes.
Key benefits
- Support for PetroApp fuel card integration.
- Simplifies fuel transaction management for PetroApp users.
- Maintains the existing fuel data import workflow.
- Keeps fuel records accurate and up to date.
Business impact
By supporting more fuel card providers, Trakzee gives system integrators greater flexibility to meet regional customer requirements. It also helps fleet operators integrate their preferred fuel providers without disrupting existing fuel management workflows.
Now, connecting your fleet with the right fuel card provider is easier than ever.
1.10 Monitor cargo conditions with dedicated Bluetooth (BLE) reports
Modern fleets need more than just location tracking. Whether it’s monitoring the temperature inside a refrigerated vehicle, checking humidity for sensitive cargo, or knowing exactly when a cargo door was opened, businesses need access to environmental data that traditional GPS reports alone can’t provide.
To give fleet operators a more complete picture of their assets, Trakzee now introduces a new set of BLE sensor reports. These reports transform data from Bluetooth Low Energy (BLE) sensors into actionable insights, helping businesses monitor cargo conditions, improve operational visibility, and strengthen security.
What’s added
Trakzee now supports three dedicated BLE sensor reports:
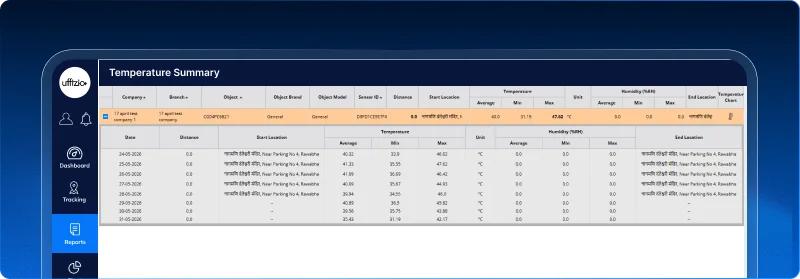
- Temperature Summary Report – View average, minimum, and maximum temperature readings along with humidity trends for each vehicle. The report also includes an interactive temperature chart for easier analysis.
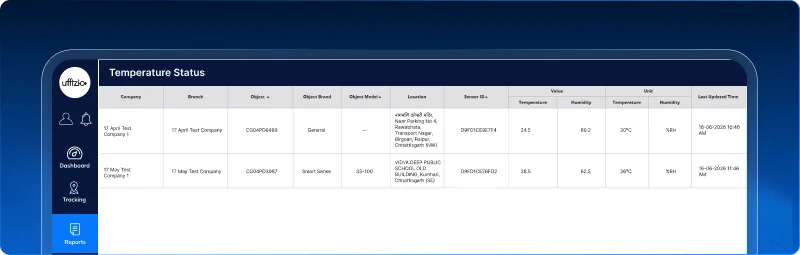
- Temperature Status Report – Monitor the latest temperature and humidity readings from BLE sensors in near real time, helping teams quickly identify abnormal conditions.
- Door Report – Track every door open and close event with timestamps, locations, ignition status, and event duration to improve cargo security and operational monitoring.
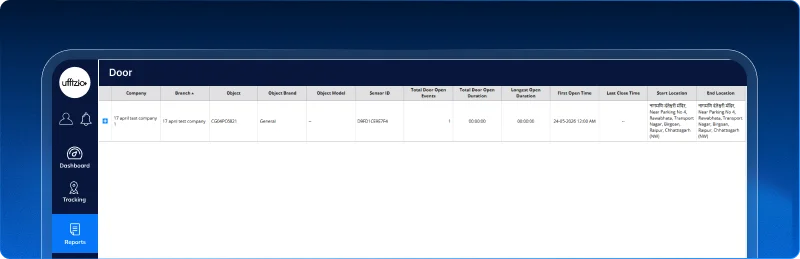
As part of this enhancement, the existing Port field has also been replaced with Sensor ID, making BLE sensor identification clearer and more consistent across reports.
Key benefits
- Monitor temperature, humidity, and door activity using dedicated BLE reports.
- Gain better visibility into cargo conditions and environmental data.
- Improve security by tracking every door open and close event.
- Export or schedule reports for regular monitoring and compliance.
Business impact
BLE sensors unlock a new layer of operational intelligence that goes far beyond GPS tracking. With dedicated reporting for environmental conditions and door activity, fleet operators can better protect temperature-sensitive goods, strengthen cargo security, and meet customer or regulatory requirements. For system integrators, these reports create new opportunities to deliver value-added solutions for industries such as cold chain logistics, pharmaceuticals, food distribution, and asset monitoring.
“Now, your reports don’t just tell you where your fleet is, they tell you what’s happening inside it.”
1.11 Stay informed about every driver change
In many fleet operations, vehicles are driven by multiple drivers throughout the day. A driver may complete one shift, hand over the vehicle to another driver, and the journey continues without interruption.
Until now, live tracking only displayed the current driver, making it difficult for fleet managers to understand recent driver changes especially when a vehicle was stopped. Without knowing who previously operated the vehicle, verifying shift handovers or investigating operational events often required additional effort.
This enhancement brings that missing context directly into live tracking, making driver transitions easier to understand at a glance.
What’s updated
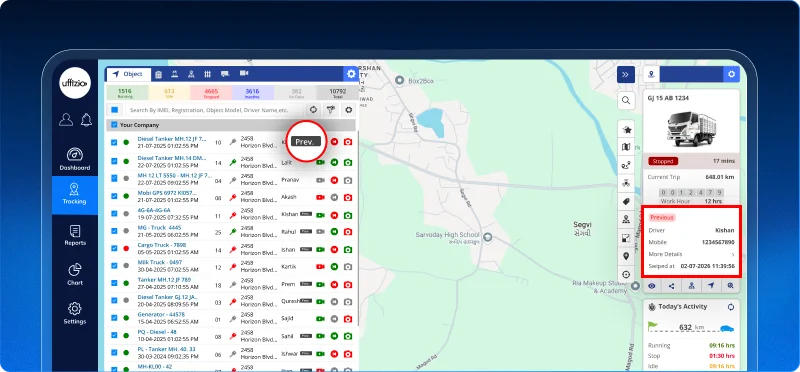
Live tracking now displays Previous driver information for vehicles using RFID or Beacon-based driver identification.
When a vehicle is in the STOP state, the previous driver’s name is shown in the live tracking tooltip and object list, giving managers instant visibility into the most recent driver change. If no previous driver information is available, the field remains hidden to keep the interface clean and relevant.
The same information is also reflected in the status dashboard and live tracking view of the mobile application, ensuring consistent visibility across platforms.
Key benefits
- View the most recent driver handover directly from live tracking.
- Quickly identify previous drivers without checking separate records.
- Improve visibility during shift changes and vehicle stoppages.
- Maintain a cleaner interface by displaying the information only when relevant.
Business impact
Driver changes are common in fleet operations, but understanding those transitions shouldn’t require additional investigation. By displaying the previous driver at the right time, this enhancement helps fleet managers improve operational visibility, verify driver handovers more efficiently, and respond faster to day-to-day fleet activities.
“Now, every driver change comes with the context you need to make better operational decisions.”
1.12 Plan and manage routes before vehicles hit the road
Every fleet has routes that are driven repeatedly—delivery routes, inspection paths, service corridors, and planned survey areas. Until now, these routes could only be saved after a vehicle had actually travelled them through the Playback module. That meant route creation was always reactive and tied to a specific vehicle.
With the new Path Management Module, route planning becomes proactive. Fleet teams can now create, manage, and reuse paths independently, making it easier to prepare operations before vehicles even leave the yard.
What’s added
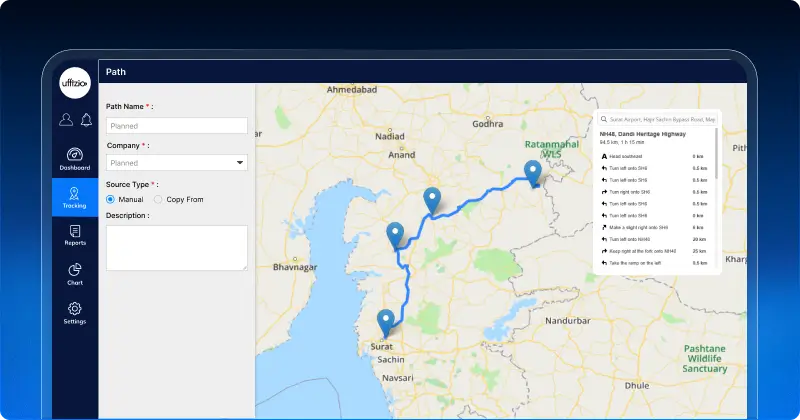
Fleet managers can create paths in two ways by manually drawing them on an interactive map or by importing an existing vehicle route from Playback. Every path is stored centrally, allowing it to be viewed, edited, searched, exported in GPX or KML formats, and reused whenever needed.
The module also provides waypoint management, live distance calculation, path previews, and advanced editing tools, giving users complete control over how routes are created and maintained.
 Key benefits
- Create routes before any vehicle starts its journey.
- Reuse planned paths across multiple vehicles and operations.
- Edit, manage, and export routes from a centralized location.
- Save time by importing existing vehicle routes from Playback.
Business impact
Moving route management out of Playback and into a dedicated module gives fleet operators greater flexibility in planning and standardizing operations. Whether it’s logistics, field service, utility inspections, or municipal operations, organizations can build reusable routes once and use them across their fleet. For system integrators, this opens new opportunities to deliver route planning capabilities that improve operational efficiency while reducing manual effort.
“Now, routes can be planned ahead of time, not just recorded after the journey is complete.”
1.13 Remove multiple expense records with ease
Managing expense records is part of everyday fleet operations. But when incorrect entries are uploaded or multiple records need to be removed, deleting them one by one can quickly become a repetitive and time-consuming task.
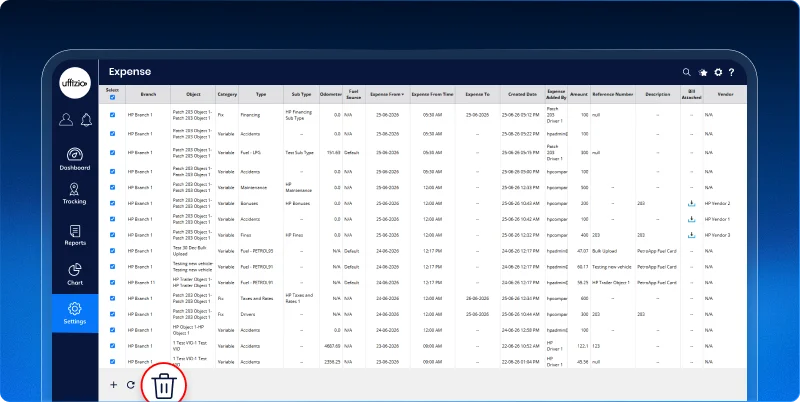
To make expense management faster and more convenient, Trakzee now supports bulk deletion directly from the Expense Overview screen.
What’s updated
Expense records can now be selected individually, in groups, or all at once using simple checkboxes.
Once records are selected, a footer action bar appears with a delete option. Before any records are removed, the platform displays a confirmation prompt to help prevent accidental deletions. After confirmation, the selected records are deleted and the changes are immediately reflected across reports, widgets, and live tracking.
Key benefits
- Delete multiple expense records in a single action.
- Save time when correcting bulk uploads or outdated entries.
- Reduce repetitive manual effort.
- Keep expense data consistent across the platform.
Business impact
Managing expense data becomes significantly more efficient, particularly for fleets handling large volumes of records. For system integrators, this enhancement improves the overall user experience by simplifying data maintenance while ensuring operational reports always reflect the latest information.
“Now, cleaning up expense records takes minutes instead of countless clicks.”
1.14 Expanding IVR communication options
Voice calls continue to play an important role in fleet operations, especially for critical alerts that require immediate attention. Since communication preferences and service providers vary across regions, supporting multiple IVR providers helps businesses choose the solution that best fits their operational needs.
To offer greater flexibility, Trakzee has expanded its IVR integration capabilities.
What’s added
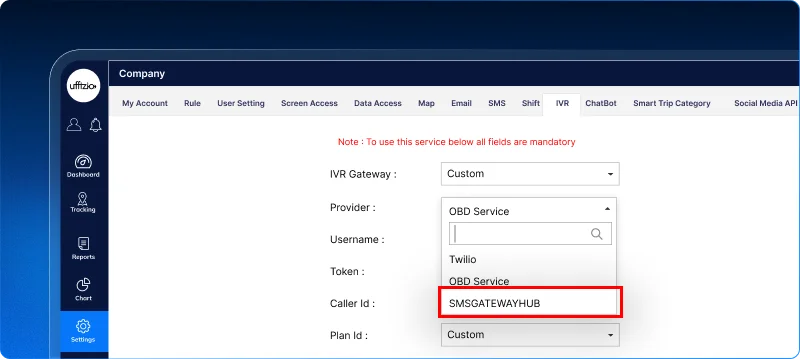
Trakzee now supports integration with the SMSGATEWAYHUB IVR Voice API provider.
Organizations using SMSGATEWAYHUB can seamlessly deliver automated voice notifications through their existing IVR workflows without changing the platform’s alerting process.
Key benefits
- Support for the SMSGATEWAYHUB IVR Voice API.
- More flexibility when choosing an IVR provider.
- Seamless integration with existing voice notification workflows.
- Better support for region-specific communication requirements.
Business impact
Adding support for another IVR provider gives system integrators more deployment options and helps organizations integrate Trakzee with their preferred communication services. It also makes voice-based alerting more adaptable to different business and regional requirements.
“Now, reaching the right people with critical voice alerts is more flexible than ever.”
1.15 Keep unavailable vehicles out of active operations
Not every vehicle that goes out of operation has broken down. Sometimes it’s unavailable because of bad weather, regulatory restrictions, scheduled inspections, or other operational reasons. Yet until now, there was no dedicated way to identify these situations, making it easy for unavailable vehicles to be mistakenly assigned for new trips.
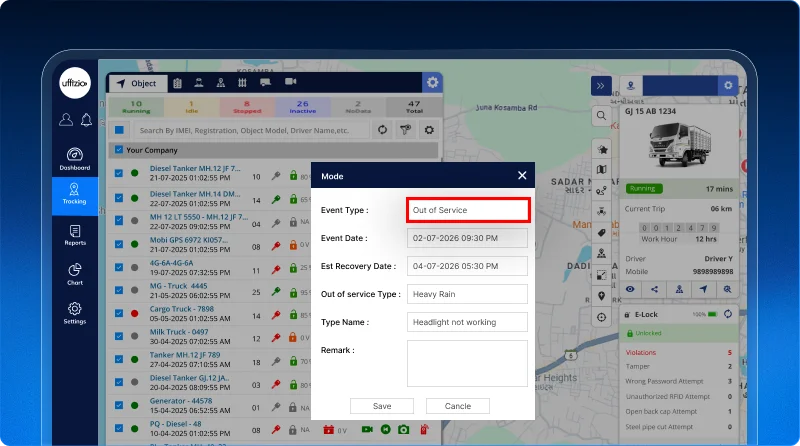
To help fleet managers make better allocation decisions, Trakzee introduces a dedicated Out of Service mode.
What’s added
A new out of service vehicle mode is now available across the web platform, Manager App, and driver app.
When marking a vehicle as out of service, users can specify the event date, estimated recovery date, reason, and remarks. Custom reasons can also be created to match an organization’s operational needs.
The selected status is reflected throughout the platform including live tracking, object lists, tooltips, and the Object Mode Summary Report making unavailable vehicles easy to identify and filter during daily operations.
Key benefits
- Clearly identify vehicles that are temporarily unavailable.
- Prevent accidental allocation of out-of-service vehicles.
- Capture reasons and recovery timelines for better planning.
- Filter vehicles based on their operational status and reason.
Business impact
By separating operational unavailability from breakdowns and accidents, fleet teams gain a more accurate picture of vehicle availability. This leads to better dispatch planning, fewer allocation errors, and improved fleet utilization. For system integrators, it provides customers with a more practical and realistic way to manage fleet operations.
“Now, every unavailable vehicle tells you not just that it’s out of service but also why.”
1.16 Get complete vehicle details in every trip report
When reviewing travel and trip reports, identifying a vehicle often requires more than just its name or registration number. Details like the vehicle’s brand, model, and type provide valuable context, especially for organizations managing diverse fleets.
To make reporting more informative, Trakzee has expanded the vehicle information available in both web and mobile reports.
What’s updated
The Travel Summary Report and Trip Summary Report now include an Object Type column on the web platform.
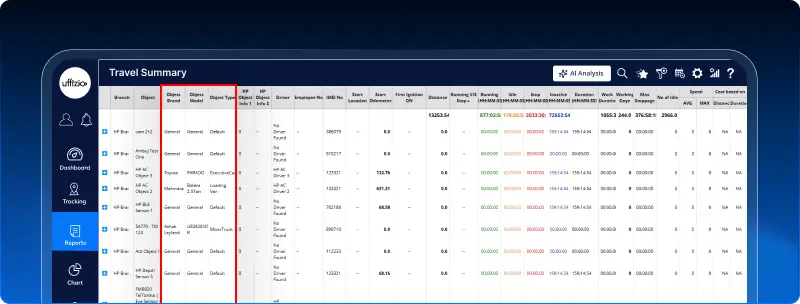
On the mobile application, these reports have also been enhanced with Object Brand, Object Model, and Object Type columns in the textual report view.
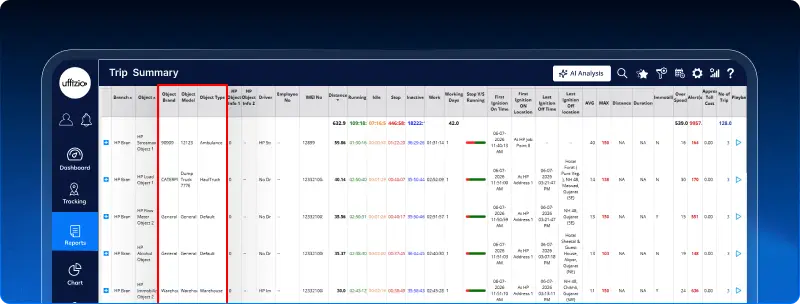
The additional fields are available in scheduled reports as well as exported report formats, ensuring the same level of detail across every reporting channel.
Key benefits
- View more complete vehicle information within reports.
- Identify vehicles faster without switching screens.
- Maintain consistency across web, mobile, scheduled, and exported reports.
- Improve reporting clarity for mixed fleet operations.
Business impact
Providing richer vehicle information directly within operational reports reduces the need for manual cross-referencing and makes report analysis more efficient. Whether reviewing fleet performance, sharing reports with customers, or conducting audits, users now have all the necessary vehicle details in one place.
“Now, every trip report gives you the complete picture of the vehicle behind the journey.”
1.17 Never miss a long-idle vehicle with repeat alerts
A single alert is helpful but what if a vehicle stays inactive for days?
Until now, Trakzee generated only one inactive alert after the configured inactivity duration was reached. If no action was taken, there were no further reminders, making it easy for long-idle vehicles to go unnoticed during busy fleet operations.
To improve operational visibility, inactive alerts can now be configured to repeat automatically until the vehicle becomes active again.
What’s updated
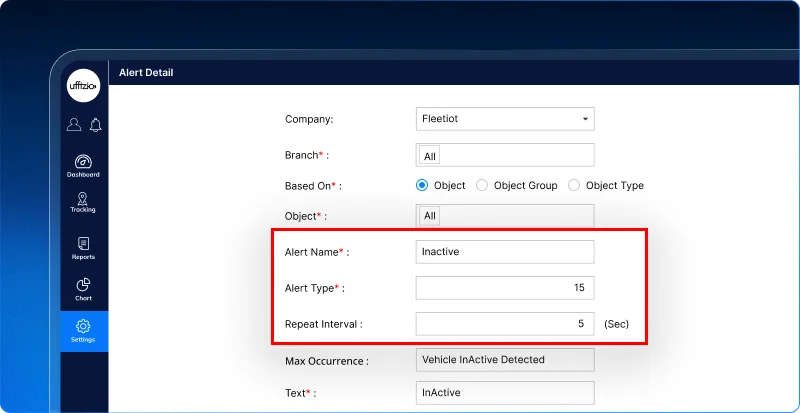
Inactive Alerts now support repeat notifications using configurable Repeat Interval and Maximum Occurrence settings.
The platform continues to use the existing Company Rule for the initial inactivity duration. Once the first alert is triggered, additional alerts can be sent at defined intervals for the specified number of occurrences. As soon as the vehicle becomes active, the alert cycle resets automatically.
This enhancement is available on both the web platform and mobile application.
Key benefits
- Receive automatic reminders for vehicles that remain inactive.
- Configure how frequently alerts should repeat.
- Prevent long-idle vehicles from being overlooked.
- Reset the alert cycle automatically when vehicle activity resumes.
Business impact
Repeated notifications help fleet managers identify vehicles that require attention without relying on manual follow-ups. Whether a vehicle is unexpectedly idle due to operational issues, maintenance, or prolonged inactivity, continuous alerts ensure it stays on the team’s radar, enabling quicker action and better fleet utilization.
“One alert starts the conversation. Repeat alerts make sure it isn’t forgotten.”
1.18 Find cloud downloads faster with smart filters
As the number of cloud download requests grows, finding the right one becomes increasingly difficult. This is especially true for organizations managing multiple companies and branches, where hundreds of requests can quickly fill the Cloud Download screen.
Instead of scrolling through long lists, users can now narrow down results and find exactly what they’re looking for in just a few clicks.
What’s updated
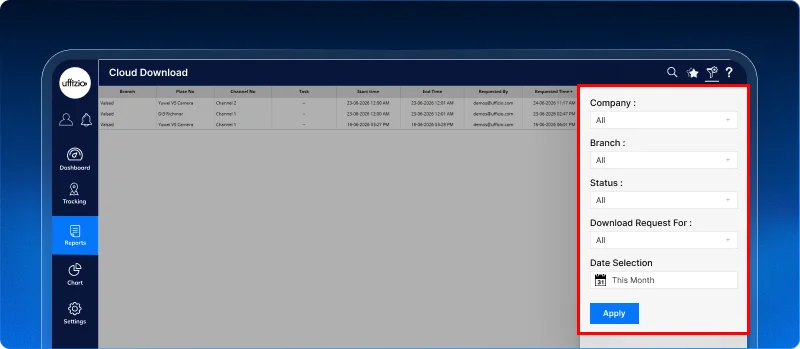
The Cloud Download screen on both the web platform and mobile application now includes a dedicated filter panel.
Users can filter download requests by Company, Branch, Request Date Range, and Status to quickly locate specific records. The selected filters remain available during the active session, allowing users to continue their work without repeatedly configuring the same search criteria.
Key benefits
- Find download requests faster using multiple filter options.
- Reduce time spent searching through large request lists.
- Quickly identify pending, in-progress, or completed downloads.
- Continue working with filters preserved during the active session.
Business impact
For organizations handling a high volume of cloud download requests, smart filtering significantly improves productivity. Administrators and operators can quickly locate the information they need, making day-to-day monitoring and request management faster, simpler, and more efficient.
“Now, finding the right cloud download is as easy as applying the right filter.”
1.19 Interactive sorting for dashboard reports
Dashboard reports often contain dozens of records, making it difficult to quickly identify the information that matters most. Whether you’re looking for the longest trip, the highest speed, or the latest activity, scanning through rows or exporting the report to Excel takes unnecessary time.
To make report analysis faster and more interactive, Trakzee now introduces column-level sorting across dashboard widget reports.
What’s updated
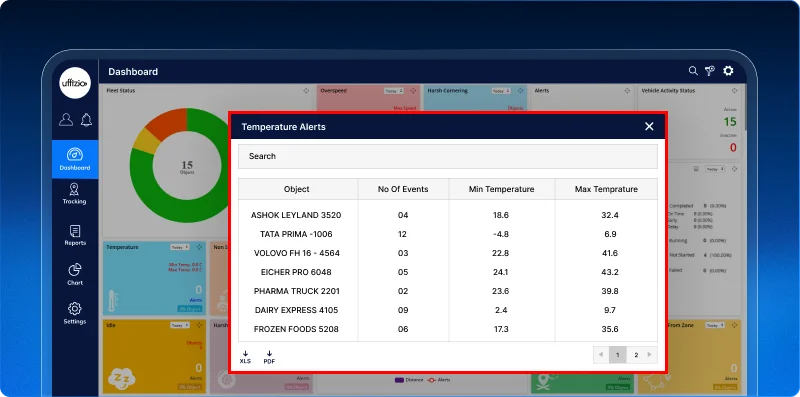
Users can now sort supported columns in textual reports opened from dashboard widgets on both the web platform and mobile application.
A simple click or tap on a column header lets users switch between ascending, descending, and default order. The selected sorting is maintained while navigating through report pages and is also applied when exporting reports to PDF or XLS, ensuring the same view across every format.
Key benefits
- Sort report data directly from dashboard widgets.
- Find important records faster without exporting data.
- Maintain sorting across paginated report pages.
- Export reports in the same sorted order you’re viewing.
Business impact
Interactive sorting makes operational reports far more useful for day-to-day decision-making. Fleet managers can quickly identify trends, exceptions, and key metrics without manually scanning large datasets. For system integrators, it delivers a more intuitive reporting experience while reducing the need for external analysis tools.
“Now, the answers you’re looking for are just one click away.”
1.20 Choose the most accurate source for engine work hours
Not all tracking devices measure engine work hours the same way. While many fleets rely on sensor ports, newer CAN-enabled devices can provide engine work hour data directly from the vehicle itself often with greater accuracy.
To help organizations make the most of their hardware, Trakzee now gives users the flexibility to choose which data source should be used for engine work hour calculations.
What’s updated
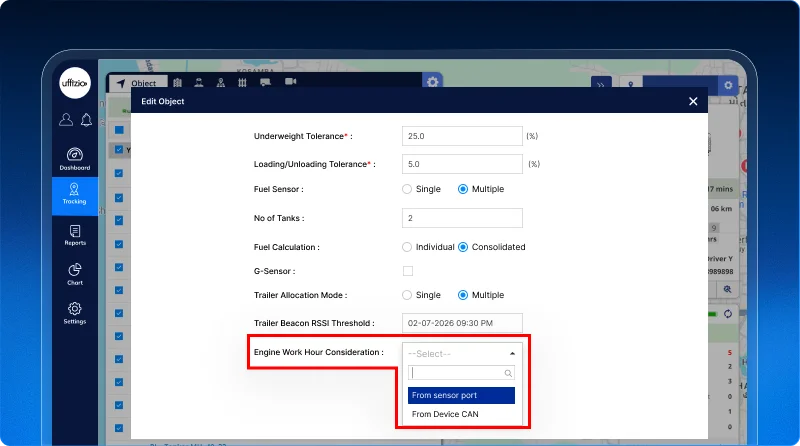
A new Engine Work Hour Consideration setting has been added to the Object Profile.
Users can now choose whether engine work hours should be calculated using the existing Sensor Port method or directly from CAN data. Once selected, the chosen method is automatically applied across live tracking, dashboards, reports, charts, reminders, and every module where work hour information is displayed.
Key benefits
- Choose the most suitable source for engine work hour calculations.
- Take advantage of more accurate CAN-based engine hour data.
- Maintain consistent work hour values across the platform.
- Support both legacy sensor-based devices and modern CAN-enabled hardware.
Business impact
Different fleets use different hardware, and a one-size-fits-all calculation method doesn’t always deliver the best results. By supporting both Sensor Port and CAN-based work hour calculations, Trakzee gives system integrators greater deployment flexibility while helping customers improve the accuracy of maintenance planning, utilization analysis, and work hour reporting.
“Because better decisions begin with more accurate engine data.”
1.21 A new object type for mining fleets
Mining operations involve much more than trucks and excavators. Specialized equipment like drilling machines plays a critical role in exploration, blasting, and site preparation, making it just as important to monitor and manage as any other fleet asset.
To better support mining businesses, Trakzee now introduces a dedicated object type for drilling equipment.
What’s added
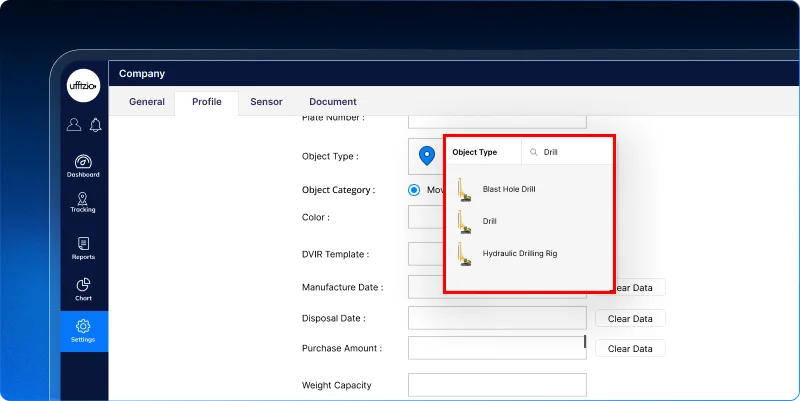
A new Drill object type has been added to the object configuration screen, along with its own dedicated icon.
Organizations can now classify drilling equipment separately while configuring assets, making it easier to identify, organize, and manage these specialized machines across the platform.
Key benefits
- Configure drilling equipment using a dedicated object type.
- Improve asset classification for mining operations.
- Quickly identify drill machines with a dedicated icon.
- Keep specialized equipment organized alongside the rest of your fleet.
Business impact
Every industry has assets that require specialized management. By expanding object types to include drilling equipment, Trakzee continues to support industry-specific fleet operations, helping system integrators deliver more tailored solutions for mining and heavy equipment customers.
“Because every specialized machine deserves to be managed as the asset it is.”
1.22 Control who can access live camera audio
Not every user monitoring a live camera feed needs access to its audio. In many organizations, audio permissions depend on operational roles, privacy policies, or customer requirements. Until now, audio availability couldn’t be managed independently, making it difficult to provide the right level of access to different users.
To offer greater control, Trakzee now introduces dedicated permissions for live camera audio.
What’s updated
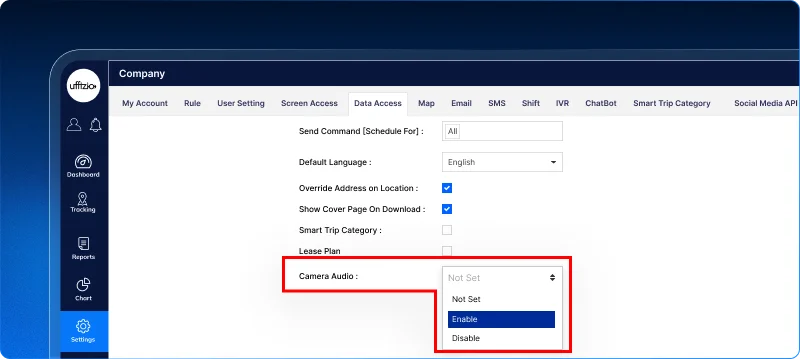
A new Camera Audio Access setting has been added to both user-level and vehicle-level configurations.
Administrators can now decide whether users are allowed to access live camera audio. User-level permissions always take priority over vehicle-level settings, ensuring organizations can centrally manage audio access while maintaining flexibility for individual vehicles.
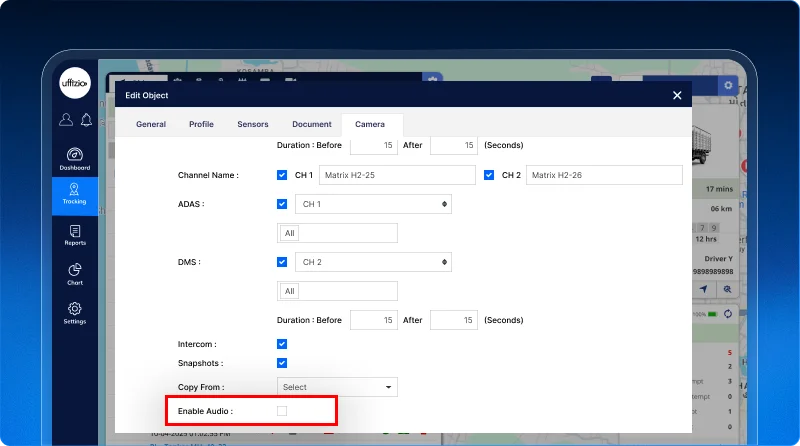
When audio access is enabled, users can mute or unmute live audio during streaming. If access is disabled, the audio control is hidden and audio is not streamed.
Key benefits
- Control live camera audio through user and vehicle permissions.
- Apply role-based audio access across the organization.
- Protect sensitive audio by restricting unauthorized access.
- Ensure consistent audio permissions across web and mobile applications.
Business impact
Role-based audio access gives organizations greater flexibility to meet operational, privacy, and compliance requirements without affecting live video monitoring. For system integrators, it provides an additional layer of security and customization, enabling deployments that align with each customer’s internal access policies.
“Now, you can decide not just who watches the live stream but who can listen to it too”
1.23 Manage camera recordings with greater flexibility
As video records continue to grow, finding the right footage and downloading it for further investigation can become a time-consuming task. Whether users are reviewing evidence videos, historical recordings, or snapshots, managing large volumes of media should be simple and efficient.
To improve the Media Gallery experience, Trakzee introduces smarter filtering and enhanced bulk download capabilities.
What’s updated
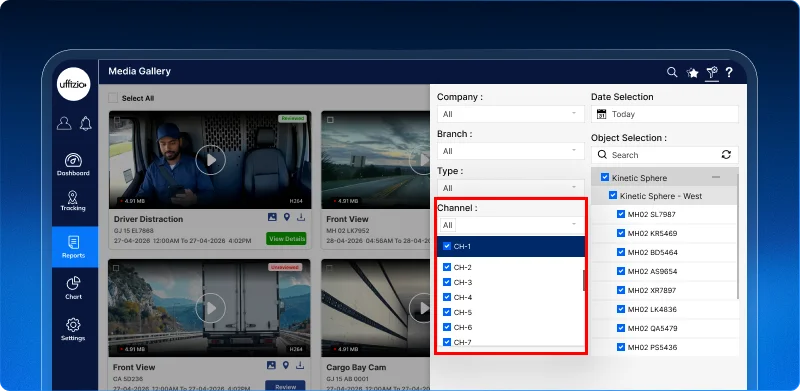
The Media Gallery now includes a Channel filter, allowing users to view media captured from a specific camera channel. The filter is available for Evidence Videos, Historical Videos, and Snapshots, helping users quickly locate recordings without manually reviewing every file.
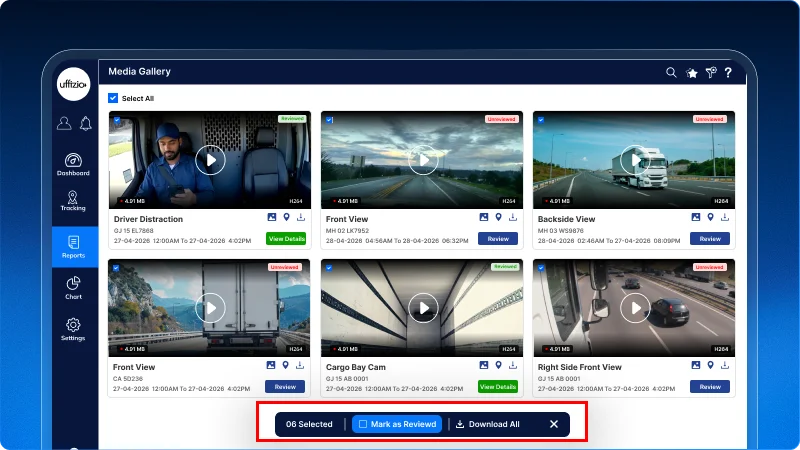
Bulk downloads have also been enhanced to support significantly larger selections. Instead of being restricted to the previous 100-file limit, users can now download all selected media files in a single ZIP package, subject to system performance validations where applicable.
Key benefits
- Filter recordings by individual camera channels.
- Find evidence videos and snapshots faster.
- Download larger batches of media in a single action.
- Reduce manual effort when handling large investigations.
Business impact
Efficient media management is critical for fleets using video telematics. With channel-based filtering and improved bulk downloads, operators can quickly locate relevant footage, export larger evidence sets, and streamline incident investigations. For system integrators, these enhancements provide a faster and more scalable media management experience for customers handling high volumes of camera recordings.
“Finding the right footage is now quicker and taking it with you is easier than ever.”
1.24 A new developer portal for faster API integrations
Building integrations shouldn’t mean searching through multiple documents or guessing how an API works. Developers need clear documentation, real examples, and a simple way to test requests before writing production code.
To make integrations faster and more developer-friendly, Uffizio introduces a dedicated Developer API Portal that brings documentation, testing, and code samples together in a single workspace.
What’s added
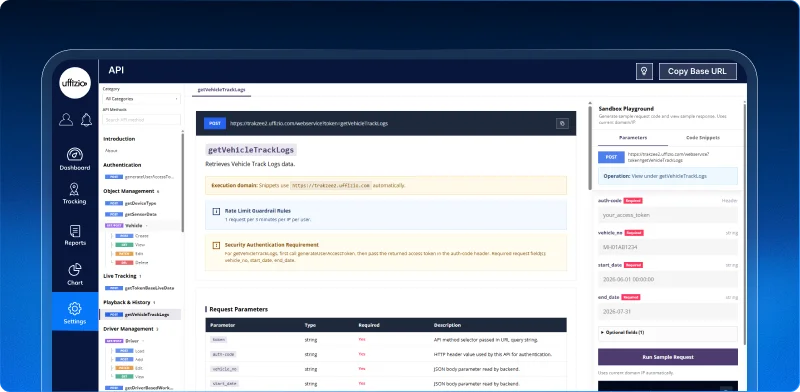
The new portal features a modern three-panel interface that combines API navigation, detailed documentation, and an interactive sandbox playground.
Developers can browse API endpoints, search documentation, generate code snippets in multiple programming languages, test requests using sample parameters, and review response structures, all without leaving the portal. The platform also includes project-based filtering, endpoint search, response validation, error references, and copy-ready code samples to simplify the entire integration process.
Key benefits
- Access API documentation from a single centralized portal.
- Test API requests with an interactive sandbox environment.
- Generate ready-to-use code snippets in multiple programming languages.
- Quickly find endpoints using project filters and live search.
- Understand responses and error handling with detailed examples.
Business impact
A well-designed developer experience directly translates into faster integrations and shorter implementation cycles. With the new Developer API Portal, system integrators and technology partners can understand, test, and integrate Uffizio APIs more efficiently, reducing onboarding time while accelerating solution deployment.
“From documentation to testing, everything developers need is now just one portal away.”
1.25 Track every fuel event during geofence trips
Fuel consumption tells only part of the story. During a trip, vehicles may also be refueled or experience unexpected fuel drains, but until now, this information wasn’t visible within the geofence trip report. Users had to rely on separate reports to understand the complete fuel activity for a journey.
To provide a more comprehensive view, Trakzee now enhances the geofence trip report with additional fuel event details.
What’s updated
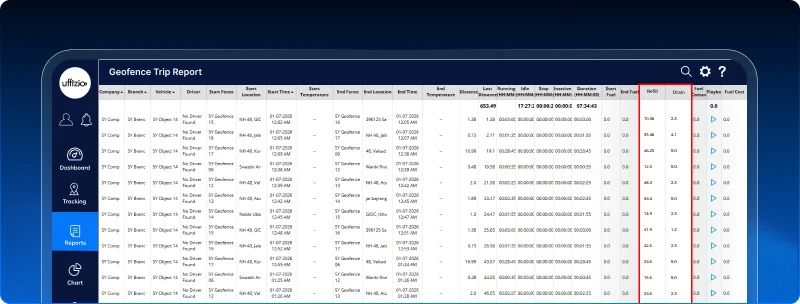
The report now includes dedicated Refill and Drain columns alongside the existing Fuel Consumption data, giving users a complete picture of fuel movement during each trip between geofences.
To maintain consistency across platforms, the mobile textual report has also been enhanced with additional fuel-related fields, including Start Fuel, End Fuel, Fuel Cost, Refill, and Drain. These new details are available in scheduled reports and exported files as well, ensuring the same level of visibility wherever the report is accessed.
Key benefits
- View fuel refill and drain events alongside trip data.
- Analyze complete fuel activity without switching reports.
- Access the same fuel insights across web and mobile.
- Include new fuel details in scheduled and exported reports.
- Improve trip-level fuel monitoring and operational analysis.
Business impact
Complete fuel visibility helps fleet operators make better decisions. By bringing fuel consumption, refills, and drain events together in a single report, Trakzee enables faster fuel analysis, improves operational transparency, and helps identify unusual fuel activity during every journey.
“Because understanding fuel efficiency starts with seeing the complete fuel story.”
2.Smartwaste Updates
2.1 Waste type selection is now available for ADHOC checkpoints
Not every waste collection happens as part of a planned route. Collection crews often create ADHOC checkpoints to record unexpected pickups, but until now, there was no way to specify what type of waste was collected. This made it difficult to track waste categories and maintain complete collection records.
To improve operational visibility, SmartWaste now allows waste types to be captured during ADHOC checkpoint creation.
What’s updated
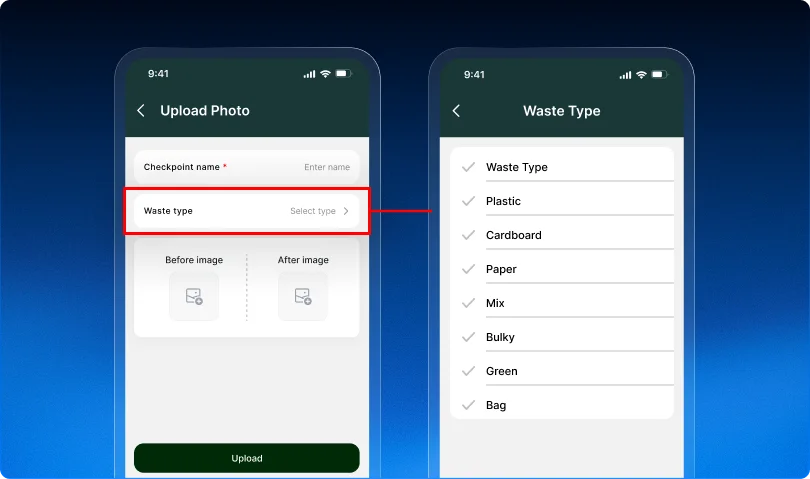
A new waste type field has been added to the ADHOC checkpoint creation screen in the collection application.
Collectors can now select the appropriate waste category while creating an ADHOC checkpoint. The selected waste type is saved with the checkpoint and is also displayed in the bin detail Tooltip on the live tracking screen, giving managers instant visibility into the type of waste collected.
The field is optional, allowing collection teams to continue creating ADHOC checkpoints even when a waste type isn’t selected.
Key benefits
- Capture waste type while creating ADHOC checkpoints.
- Improve visibility into different waste categories.
- View waste type directly from the live tracking tooltip.
- Maintain accurate records for planned and unplanned collections.
Business impact
ADHOC collections are an important part of day-to-day waste management, and every collection should provide meaningful operational data. By associating waste types with ADHOC checkpoints, SmartWaste helps municipalities and waste management companies improve waste segregation, enhance collection visibility, and maintain more informative collection records.
“Because every collection planned or unplanned should tell the complete story.”
2.2 Simplify boundary updates with KML/KMZ uploads
Administrative boundaries often change due to urban expansion, route optimization, or municipal restructuring. Until now, updating zone and ward boundaries required backend support, making even small changes dependent on technical teams and delaying day-to-day operations.
SmartWaste now makes this process much simpler by allowing authorized users to update boundaries directly from the application.
What’s updated
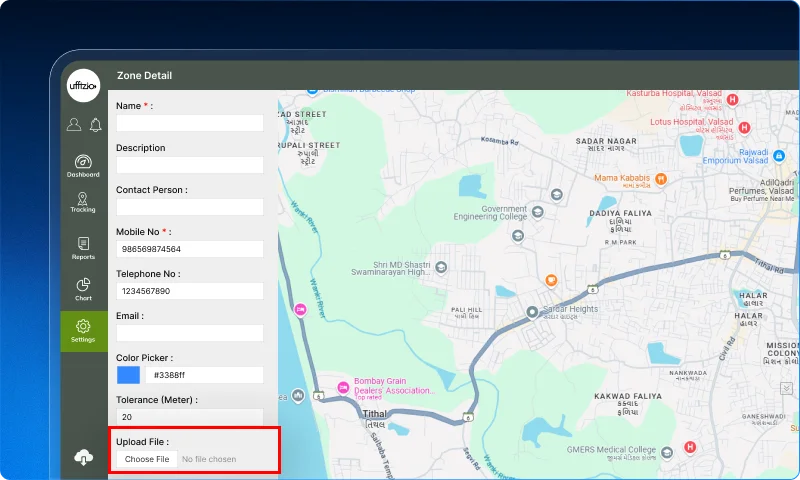
Users can now upload KML or KMZ files while editing zones and wards in the SmartWaste web application.
Once a valid file is uploaded, the system automatically processes the boundary and displays the updated polygon on the map for review before saving. This allows users to visually verify the changes and update geographical boundaries without relying on manual database updates or backend intervention.
Key benefits
- Upload KML and KMZ files directly from the web application.
- Update zone and ward boundaries without backend assistance.
- Preview updated boundaries before saving changes.
- Reduce manual effort and speed up administrative updates.
- Ensure more accurate and up-to-date geographical mapping.
Business impact
Municipal boundaries evolve over time, and updating them shouldn’t require technical intervention. By enabling direct boundary uploads, SmartWaste gives municipal teams greater control over their operational maps, reduces turnaround time for boundary changes, and helps ensure collection zones always reflect the latest administrative requirements.
“Because keeping your maps up to date should be as easy as uploading a file.”
2.3 Keep job data secure with role-based access control
Managing user permissions is essential for ensuring that the right people have access to the right information. Previously, disabling the Job module for a user removed it from the web application, but Job Tracking data could still appear in the Waste Manager mobile application, creating an inconsistent user experience.
To strengthen access control, SmartWaste now applies Job module permissions consistently across both platforms.
What’s updated
The backend now validates Job module access rights before sending Job Tracking data.
If Job module access is disabled for a user, the API no longer returns any Job-related information. As a result, Job Tracking is automatically hidden in the Waste Manager mobile application without requiring any additional mobile-side configuration.
Key benefits
- Enforce consistent Job module permissions across web and mobile.
- Ensure only authorized users can access Job Tracking data.
- Eliminate permission mismatches between platforms.
- Improve security with centralized, role-based access control.
Business impact
Consistent permission management is critical for organizations that operate with multiple user roles and responsibilities. By enforcing Job module access at the backend level, SmartWaste helps municipalities and waste management companies protect operational data, simplify user management, and ensure every user only sees the information relevant to their role.
“Because stronger security starts with consistent access control.”
2.4 Manage multiple checkpoints in a single selection
Managing a large number of checkpoints can quickly become time-consuming when each one has to be selected individually. Whether adding, moving, or removing checkpoints, manual selection slows down operations and increases the chances of missing important locations.
To make large-scale checkpoint management faster and more efficient, SmartWaste now introduces area-based bulk checkpoint selection in live tracking.
What’s updated
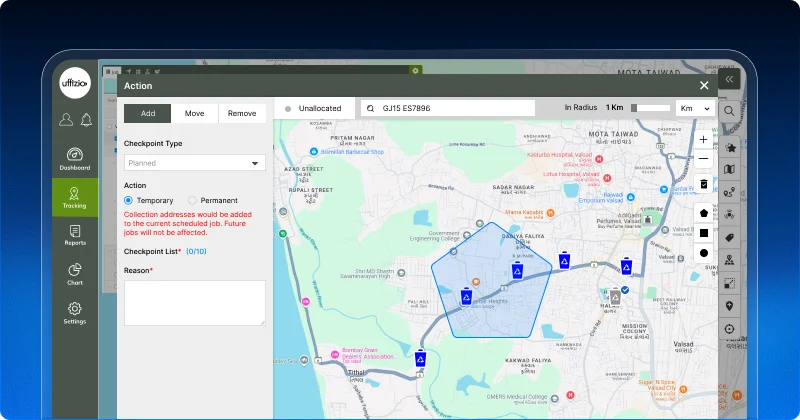
Users can now draw a polygon, rectangle, or circle directly on the map to select multiple checkpoints at once.
Once an area is selected, all checkpoints within that boundary are automatically highlighted and can be processed together using the existing Add, Move, or Remove actions. The current workflows remain unchanged, making it easy to adopt the new functionality without changing existing operational processes.
Key benefits
- Select multiple checkpoints in a single action.
- Use polygon, rectangle, or circle selection directly from the map.
- Perform bulk Add, Move, or Remove operations more efficiently.
- Reduce manual effort while managing large checkpoint groups.
- Continue using existing workflows with a faster selection process.
Business impact
As waste collection operations grow, managing checkpoints individually becomes increasingly inefficient. By introducing area-based bulk selection, SmartWaste helps supervisors complete operational updates much faster, minimize manual errors, and improve productivity when handling large collection zones.
“Because managing 50 checkpoints should be just as easy as managing one.”
2.5 Monitor every active shift from a single dashboard widget
Collection managers often need to switch between multiple screens to understand how an active shift is progressing. Checking remaining shift time, active jobs, upcoming collections, and vehicle deployment separately can slow down decision-making, especially during busy operations.
To make shift monitoring faster and more intuitive, SmartWaste now introduces the active shift monitor widget.
What’s updated
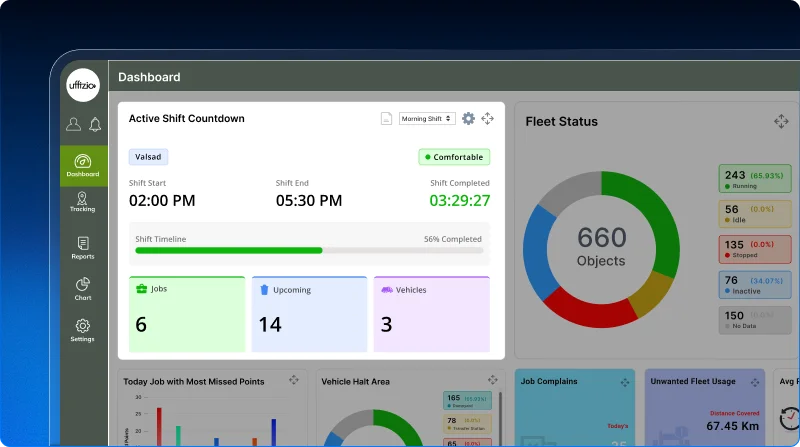
The new dashboard widget provides a real-time overview of the active shift for the selected town. It displays a live countdown to shift completion, a visual progress bar showing how much of the shift has elapsed, and configurable urgency indicators that highlight when operations need closer attention.
Alongside the shift status, the widget also shows key operational metrics such as the number of active jobs, upcoming collection addresses, and vehicles currently deployed. Managers can even customize urgency thresholds to match their operational preferences, helping them identify potential delays before they become critical.
Key benefits
- Monitor the remaining shift time with a live countdown.
- Track shift progress using a real-time visual timeline.
- View active jobs, upcoming collection addresses, and deployed vehicles in one place.
- Configure urgency levels to match operational requirements.
- Make faster decisions with a centralized view of ongoing collection activities.
Business impact
Effective shift management depends on having the right information at the right time. By bringing live shift progress, operational statistics, and urgency indicators into a single dashboard widget, SmartWaste helps supervisors identify delays sooner, allocate resources more effectively, and keep collection operations running smoothly throughout the day.
“Because better decisions start with complete operational visibility.”
2.6 Manage vehicle and workforce allocation with greater control
During daily waste collection operations, vehicle and workforce allocations often need to be updated quickly. However, allowing every user to make permanent changes can lead to accidental route modifications that continue into future shifts, creating unnecessary operational challenges.
To provide greater control and reduce such risks, SmartWaste now introduces role-based permissions for allocation changes.
What’s updated
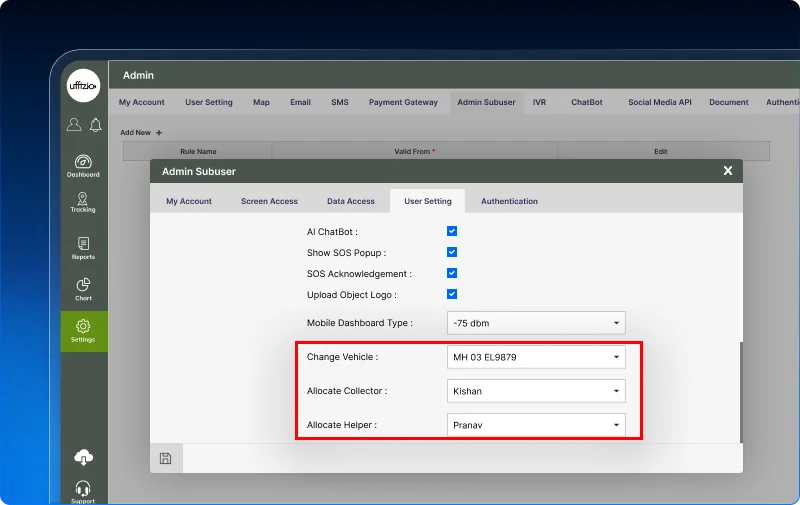
Administrators can now configure separate permissions for vehicle, collector, and helper allocation changes directly from the user settings.
For each allocation type, users can be granted access to perform temporary, permanent, or both types of changes based on their responsibilities. The live tracking screen automatically displays only the actions and allocation options that the logged-in user is authorized to perform, helping prevent unauthorized or accidental permanent updates.
Key benefits
- Control vehicle, collector, and helper allocation permissions independently.
- Allow temporary or permanent allocation changes based on user roles.
- Prevent unauthorized operational modifications.
- Reduce accidental permanent allocation changes.
- Ensure a safer and more controlled live tracking experience.
Business impact
Operational flexibility is important, but so is maintaining control over critical allocation decisions. By introducing granular permission management, SmartWaste helps municipalities and waste management companies reduce operational errors, protect future route planning, and ensure allocation changes are performed only by authorized users.
“Because operational flexibility works best when it’s backed by the right level of control.”
2.7 Analyze collection performance with flexible date filters
Collection performance can vary from one day to the next. Sometimes supervisors need to review today’s progress, while at other times they need to compare performance over an entire week. Without flexible date filtering, these insights can be difficult to access quickly.
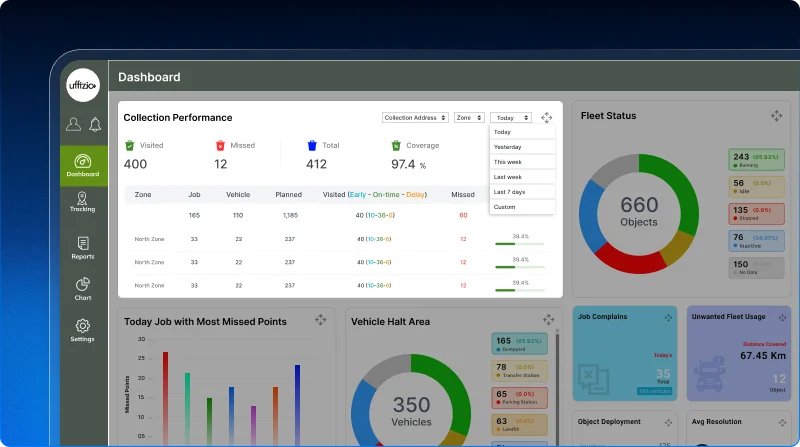
To make performance analysis more convenient, SmartWaste has enhanced the collection performance widget with flexible date-range filters.
What’s updated
The widget now supports multiple preset date filters, including today, yesterday, this week, last week, last 7 days, and a custom range.
Users can easily switch between different time periods to analyze collection performance, while built-in validation ensures that custom selections remain within faster data loading and optimal performance. The widget refreshes automatically whenever a new date range is selected, providing up-to-date operational insights.
Key benefits
- Analyze collection performance across different time periods.
- Switch quickly using preset date filters.
- Create custom reports with a maximum 7-day range.
- View refreshed performance data instantly after changing filters.
Business impact
Operational decisions often depend on comparing collection performance over different time periods. With flexible date filtering, SmartWaste enables supervisors to review daily and weekly operations more efficiently, identify performance trends faster, and make informed decisions using relevant, up-to-date data.
“Because better decisions start with seeing the right data at the right time.”
2.8 Identify potentially missed collections with smart remarks
A checkpoint may sometimes appear as visited simply because a vehicle entered the defined collection area, even if it stopped only for a moment. This can make it difficult for supervisors to determine whether waste was actually collected or if the visit was too brief to be considered a genuine service.
To improve reporting accuracy, SmartWaste now adds an intelligent validation layer to collection reports.
What’s updated
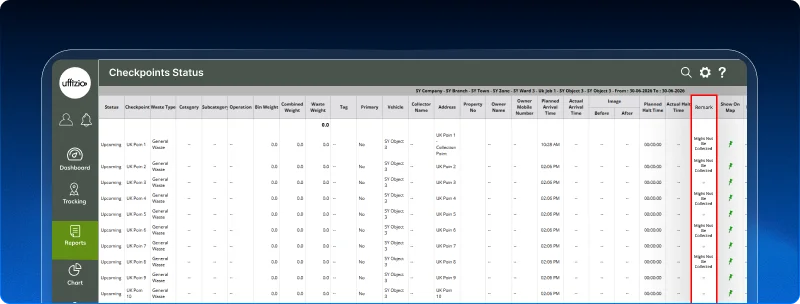
The job detail summary report now includes a new remarks column that evaluates the vehicle’s actual halt Time at each checkpoint.
If the halt duration is below the defined threshold, the report automatically displays “Might Not Be Collected”, helping supervisors quickly identify checkpoints that may require further review. This enhancement works alongside the existing visit logic without changing how checkpoint visits are recorded and is also available in the Manager Application’s textual report view.
Key benefits
- Identify checkpoints with extremely short halt durations.
- Improve confidence in collection verification.
- Review potentially missed collections more efficiently.
- Access the same validation in both web and mobile reports.
Business impact
Accurate collection reporting is essential for maintaining service quality and operational accountability. By highlighting checkpoints with negligible halt times, SmartWaste helps municipalities and waste management companies quickly identify questionable collection records, improve field verification, and make better-informed operational decisions.
“Because a visited checkpoint doesn’t always mean a completed collection.”
2.9 Show or hide ward boundaries during job tracking
When monitoring active collection jobs, supervisors often need to understand whether vehicles are operating within their assigned ward. Until now, the Job Tracking screen displayed routes and collection activities but didn’t provide the ward boundary, making it difficult to compare vehicle movement with the designated service area.
To provide better operational visibility, SmartWaste now introduces ward boundary controls in Job Tracking.
What’s updated
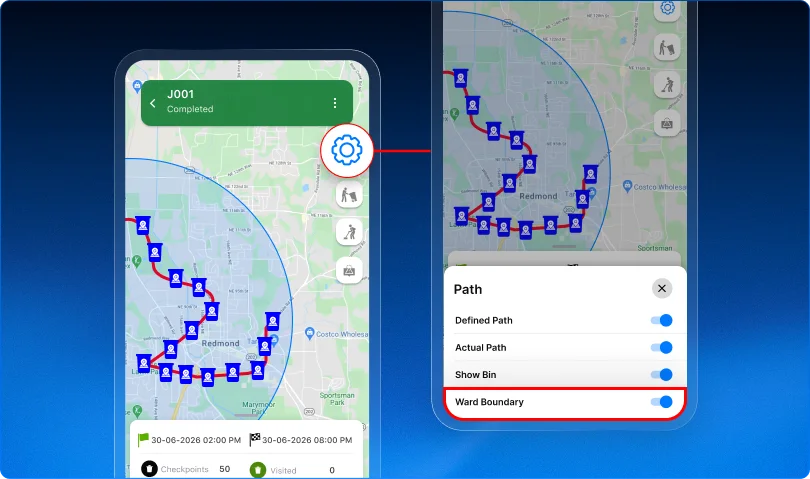
A new show/hide ward boundary option has been added to the job tracking screen.
With a single click, users can display the ward boundary associated with the selected job or hide it whenever they prefer a cleaner map view. The boundary is displayed instantly without refreshing the page, while existing route, vehicle, and bin visibility continue to work as usual.
Key benefits
- Display the assigned ward boundary directly in Job Tracking.
- Compare vehicle movement against the designated service area.
- Toggle ward boundaries on or off instantly.
- Maintain a clean map view without affecting other tracking features.
Business impact
Clear geographical context helps supervisors monitor collection activities more effectively. By displaying ward boundaries alongside active jobs, SmartWaste enables teams to verify route execution within the correct service area, improve operational monitoring, and make faster decisions without interrupting their workflow.
“Because seeing where a job happens is just as important as knowing it’s happening.”
2.10 Track every job from a single dashboard widget
Supervisors often oversee multiple collection jobs running simultaneously. Monitoring the progress of each job by navigating through individual tracking screens can be time-consuming, making it harder to get a quick overview of daily operations.
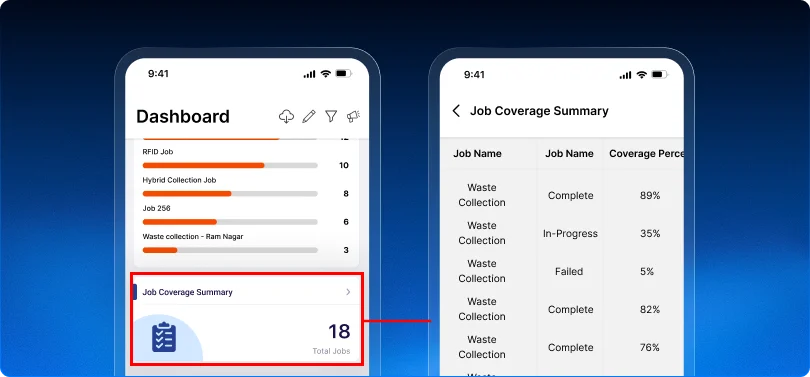
To simplify operational monitoring, SmartWaste introduces the new Job Coverage Summary widget.
What’s added
The new dashboard widget provides a consolidated view of all jobs accessible to the logged-in user. It displays the total number of active jobs and, with a single click, opens a detailed view showing key job execution metrics.
Supervisors can quickly review each job’s coverage percentage, job status, visited, upcoming, and missed collection addresses, along with the total collection points and assigned vehicles. The widget uses the existing job tracking calculations, ensuring all information remains consistent with the live tracking module.
Key benefits
- Monitor all active jobs from a single dashboard widget.
- View job coverage and collection progress at a glance.
- Access detailed job-wise performance with one click.
- Track visited, upcoming, and missed collection addresses.
- Make faster decisions using real-time operational data.
Business impact
Managing multiple collection jobs becomes much easier when all critical information is available in one place. The Job Coverage Summary widget gives supervisors instant visibility into job progress, helping them identify delays, monitor service coverage, and improve operational efficiency without switching between multiple tracking screens.
“Because when every job matters, seeing them all together makes all the difference.”
2.11 Export and print playback reports with ease
Playback is a valuable tool for reviewing completed collection journeys, but there are times when supervisors need more than an on-screen view. Whether it’s sharing route history with municipal authorities, validating service delivery, or maintaining audit records, having a downloadable report makes the process much more efficient.
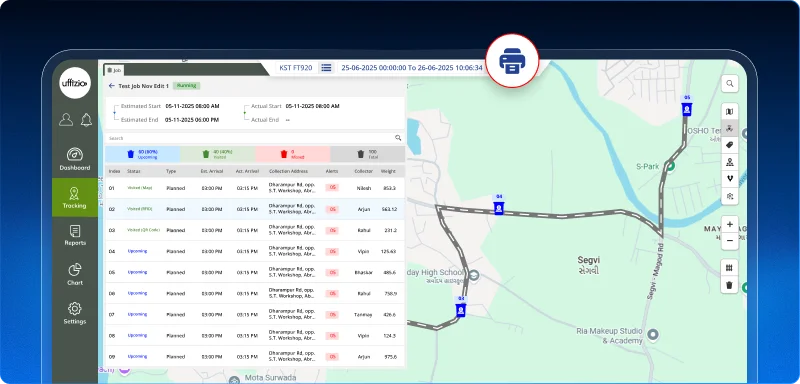
To support these operational needs, SmartWaste now allows users to print and export playback data directly from the Playback screen.
What’s updated
Users can now generate PDF reports containing playback information, including the vehicle route, stops, and visited checkpoints. The exported report provides a clear record of completed journeys, making it easy to print, archive, or share with stakeholders whenever required.
This enhancement also brings SmartWaste in line with the existing playback reporting capabilities available in Trakzee, delivering a consistent user experience across both platforms.
Key benefits
- Export playback journeys as PDF reports.
- Print vehicle routes, stops, and visited checkpoints.
- Create verifiable proof of completed collection activities.
- Share playback reports with stakeholders and municipal authorities.
- Support audit and SLA documentation with downloadable records.
Business impact
Accurate documentation is essential for demonstrating service delivery and maintaining operational transparency. With printable and exportable playback reports, SmartWaste enables municipalities and waste management companies to easily validate collection activities, simplify compliance reporting, and provide trusted records whenever proof of service is required.
“Because every completed route deserves a record that’s easy to share and verify.”
3.Gridzee updates
3.1 Create indoor barriers automatically with AI
Setting up an indoor map often requires users to manually draw barriers around walls, restricted areas, and other non-accessible spaces. For large or complex floor plans, this process can be time-consuming and may lead to inconsistencies if barriers are missed or placed incorrectly.
To make indoor map configuration faster and more accurate, Gridzee now introduces AI-powered barrier creation.
What’s added
A new AI button has been added to the Layers settings, allowing users to generate barriers automatically.
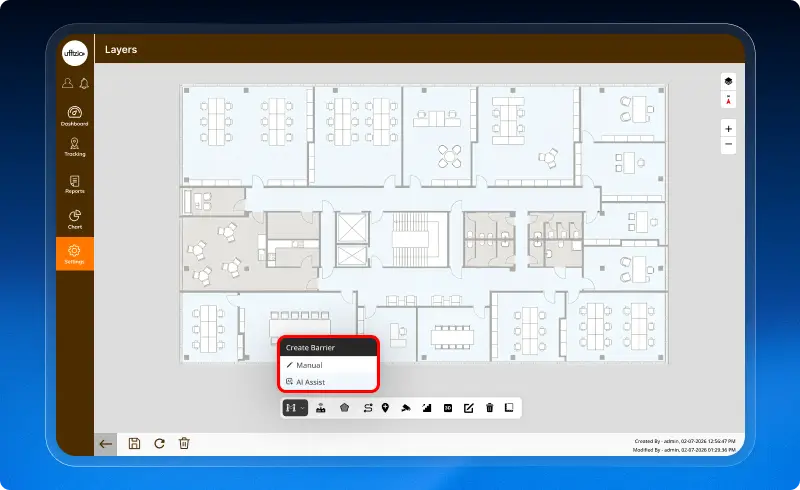
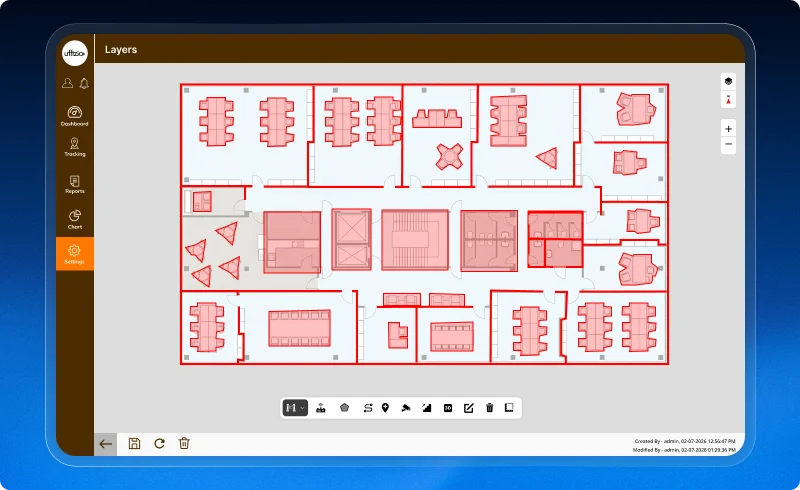
With a single click, the AI analyzes the uploaded floor plan and identifies areas where barriers should be placed. The generated barriers can then be reviewed, updated, or removed as needed, giving users complete control while significantly reducing manual effort.
Key benefits
- Generate indoor barriers automatically using AI.
- Reduce the time required to configure floor plans.
- Minimize manual barrier drawing and setup effort.
- Edit or remove AI-generated barriers whenever needed.
- Improve the accuracy and consistency of indoor map configurations.
Business impact
Accurate indoor maps are the foundation of reliable indoor tracking and navigation. By automating barrier creation, Gridzee enables organizations to deploy new floor plans more quickly, reduce configuration effort, and ensure more consistent map layouts across facilities.
“Because setting up an indoor map should take minutes not hours.”
3.2 Create and manage 3D indoor models for live tracking
Indoor environments can be difficult to visualize using traditional floor plans alone. Whether it’s a warehouse, hospital, office, or shopping mall, a realistic representation of the facility helps users better understand layouts and monitor movement with greater confidence.
To make indoor tracking more intuitive, Gridzee now supports 3D model visualization for indoor maps.
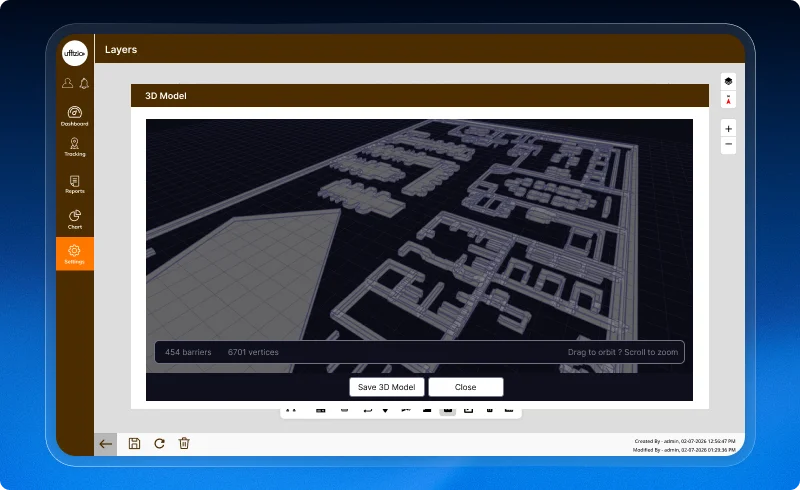
What’s added
Users can now create and save 3D models for individual layers. Once configured, the saved model is automatically available in the Live Tracking screen, where it is displayed in an interactive 3D map view.
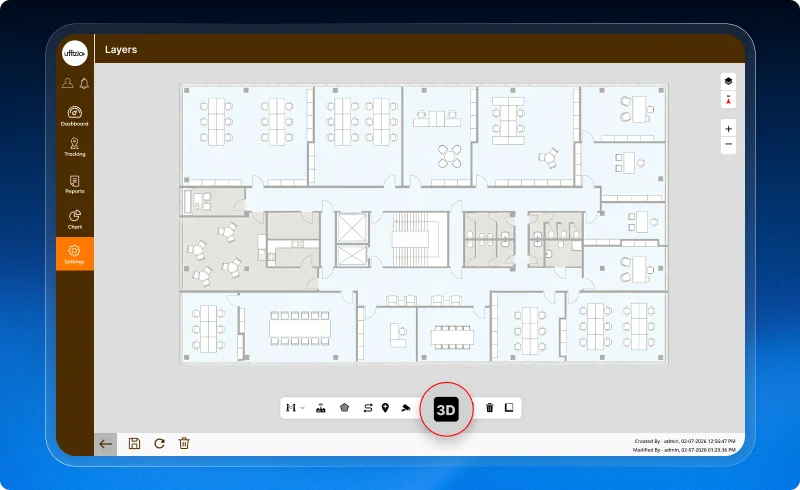
The 3D models can also be updated or replaced whenever required, making it easy to keep indoor maps aligned with changes in the physical environment.
Key benefits
- Create and manage 3D models for indoor layers.
- View indoor facilities in a realistic 3D environment.
- Improve location tracking and spatial awareness.
- Easily update or replace 3D models as layouts change.
- Deliver a more interactive Live Tracking experience.
Business impact
A realistic view of indoor spaces helps organizations monitor assets, people, and operations more effectively. By introducing customizable 3D model visualization, Gridzee improves spatial understanding, simplifies navigation, and provides a more engaging Live Tracking experience for complex indoor environments.
“Because the better you visualize your indoor space, the easier it is to understand everything happening inside it.”
3.3 Connect live IP camera feeds to indoor tracking
Knowing where people or assets are is valuable but seeing what’s happening around them provides even greater operational visibility. Until now, indoor tracking and camera monitoring worked separately, requiring users to switch between different systems to understand an event.
Gridzee now brings these two capabilities together with IP Camera Integration.
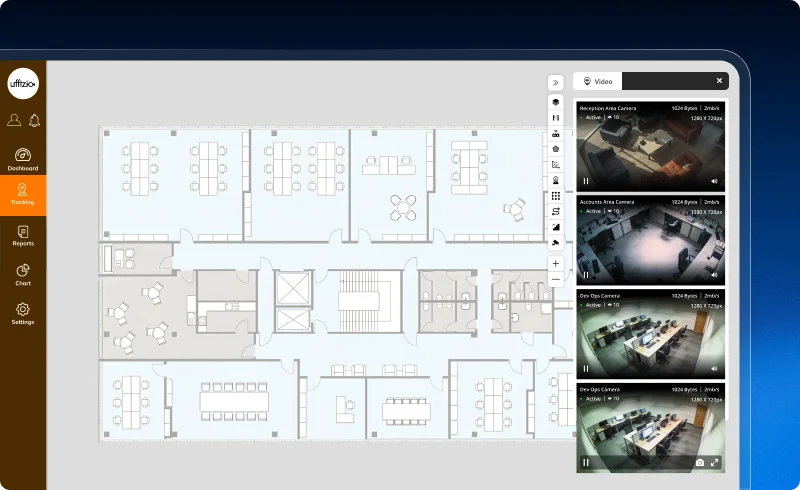
What’s added
Administrators can now add and configure IP cameras directly from Layer Settings and place them on indoor floor maps using simple drag-and-drop positioning.
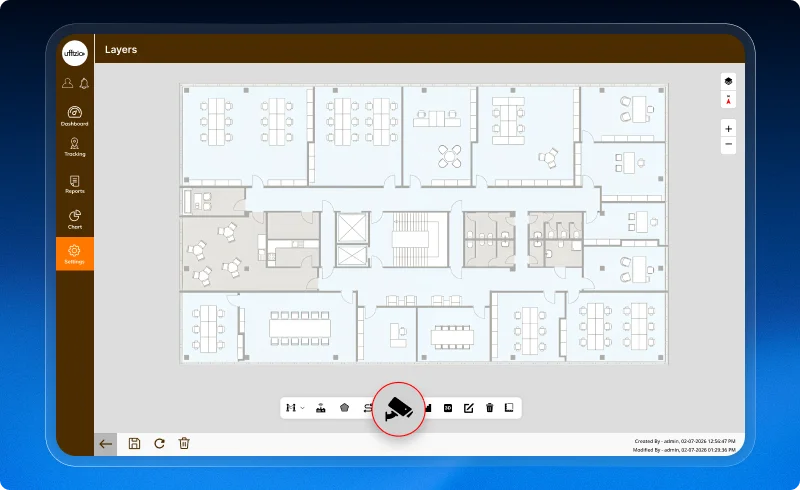
Once configured, camera icons appear on the Live Tracking map. Clicking on any camera instantly opens a live video stream in a sliding side panel while keeping the indoor map visible. Users can also open multiple camera streams simultaneously, allowing them to monitor different areas of the facility without interrupting live tracking.
Key benefits
- Configure and place IP cameras directly on indoor floor maps.
- Launch live video streams with a single click from the map.
- Monitor multiple camera feeds at the same time.
- Keep the indoor map visible while viewing live video.
- Improve visibility with synchronized tracking and video monitoring.
Business impact
Indoor operations often require more than just location data. By combining real-time tracking with live camera feeds, Gridzee gives organizations a complete operational view of their facilities, enabling faster incident response, improved security, and better decision-making from a single interface.
“Because the best decisions come from knowing both where something is and what’s happening around it.”
3.4 Create smarter indoor routes with AI suggestions
Creating navigation routes across large indoor facilities can take considerable time, especially when every path has to be configured manually. As buildings become more complex, ensuring accurate and efficient routes becomes increasingly challenging.
To make route planning faster and more reliable, Gridzee now introduces AI-powered route suggestions.
What’s added
While creating a route, users can now generate AI-powered route suggestions with a single click.
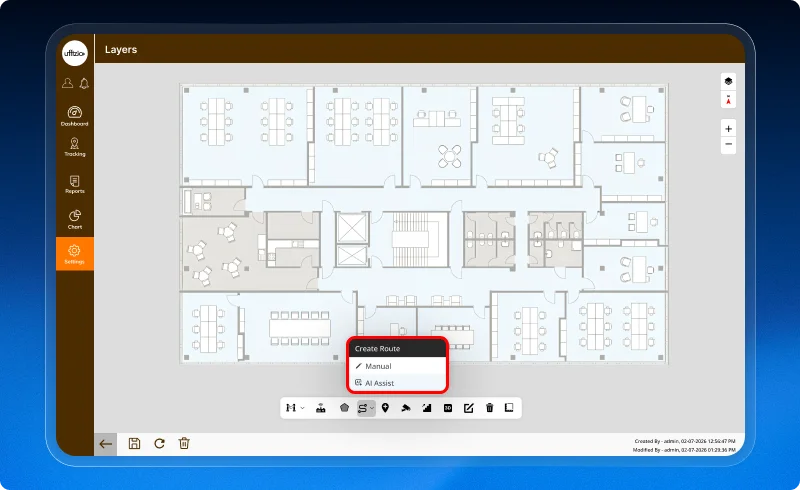
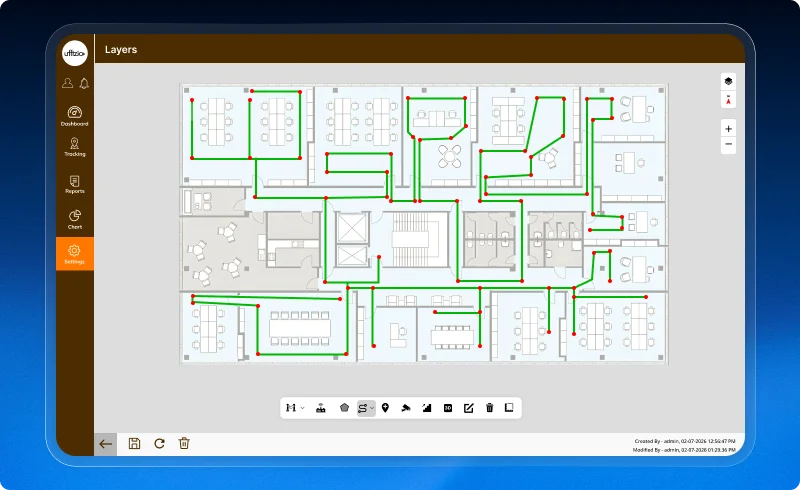
The AI analyzes the floor layout and automatically recommends the most suitable navigation path based on the available routes. Users remain in complete control—they can review the suggested route, make adjustments if needed, or accept it as is before saving.
Key benefits
- Reduce manual effort when creating indoor routes.
- Generate optimized navigation paths using AI.
- Improve route accuracy and consistency.
- Speed up indoor map configuration.
- Review and edit AI-generated routes before saving.
Business impact
Efficient route planning is essential for accurate indoor navigation and tracking. By assisting users with intelligent route suggestions, Gridzee reduces configuration time, improves route quality, and enables faster deployment of indoor maps while giving users full flexibility to refine the final result.
“Because the fastest way to create a great route is to start with an intelligent suggestion.”
3.5 Add points of interest directly from the Layers screen
Points of Interest (POIs) play an important role in indoor navigation, helping users identify locations such as meeting rooms, elevators, shops, entrances, and other key areas. Previously, adding these points required navigating through a separate workflow, making indoor map configuration more time-consuming.
To simplify the setup process, Gridzee now allows POIs to be managed directly from the Layers screen.
What’s updated
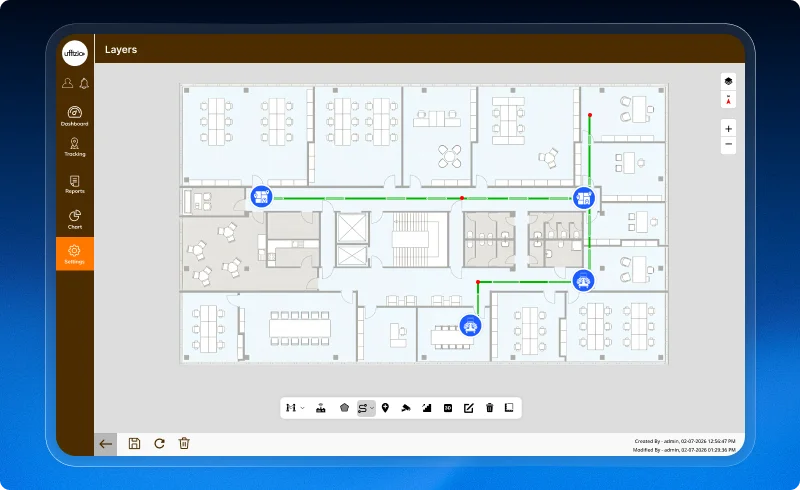
Users can now add Points of Interest (POIs) while configuring a layer, eliminating the need to switch between multiple screens during map setup.
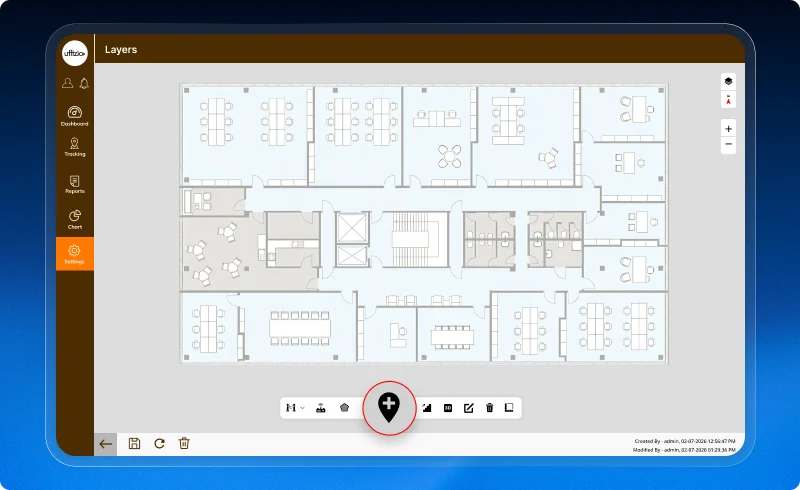
This streamlined workflow keeps layer configuration and POI management together, making it easier to build and maintain accurate indoor maps while reducing unnecessary navigation throughout the application.
Key benefits
- Add Points of Interest directly from the Layers screen.
- Reduce the number of steps required during map configuration.
- Manage layers and POIs from a single workspace.
- Speed up indoor map setup and maintenance.
- Create a more efficient and intuitive configuration experience.
Business impact
Efficient indoor map configuration is essential for accurate navigation and tracking. By bringing POI management into the Layers screen, Gridzee simplifies the overall setup process, reduces administrative effort, and enables organizations to prepare indoor maps faster while maintaining greater accuracy.
“Because configuring an indoor map should feel like one seamless workflow not multiple disconnected tasks.”
3.6 Experience a smarter, AI-powered Live Tracking
Monitoring a busy indoor environment involves much more than simply viewing the location of people and assets. As facilities grow larger and operations become more dynamic, users need quicker search capabilities, clearer map visualization, intelligent alerts, and smarter insights to respond faster and make informed decisions.
To deliver a more intuitive monitoring experience, Gridzee introduces a comprehensive upgrade to the Live Tracking module.
What’s updated
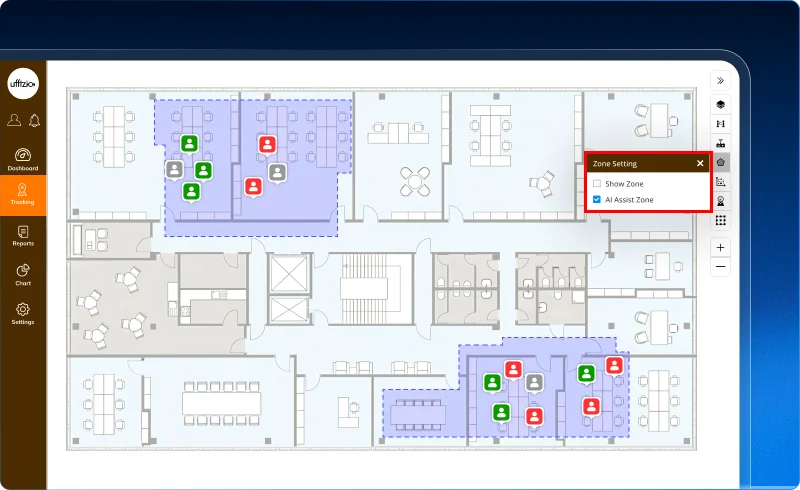
The enhanced Live Tracking screen brings together several powerful capabilities to improve day-to-day monitoring. Users can instantly search and focus on specific tags, organize objects using advanced filters and groups, and reduce map clutter with intelligent clustering.
The experience becomes even more interactive with visual alert indicators, movement trails, one-click replay of historical movements, and Focus Mode for tracking individual or multiple tags. AI also plays a bigger role by automatically identifying potential Zones of Interest based on crowd movement patterns, helping users discover high-activity areas without manual analysis.
Together, these enhancements create a faster, smarter, and more responsive indoor monitoring experience.
Key benefits
- Instantly locate people and assets using Smart Search.
- Reduce map clutter with intelligent tag clustering.
- Receive visual alerts for SOS, inactivity, and low battery events.
- Replay historical movements with configurable playback controls.
- Discover AI-generated Zones of Interest based on crowd activity.
- Organize and monitor assets using Object Groups and advanced filters.
- Improve focus with movement trails and dedicated Focus Mode.
Business impact
Modern indoor operations demand more than real-time location—they require intelligent context. By combining AI-driven insights, advanced visualization, interactive controls, and smarter search capabilities into a single Live Tracking experience, Gridzee enables organizations to monitor facilities more efficiently, respond to events faster, and make better operational decisions with greater confidence.
“Because the future of indoor tracking isn’t just about knowing where everything is it’s about instantly understanding what’s happening.”
Conclusion
Every enhancement, whether big or small, is designed with one goal in mind to help you work more efficiently and make better operational decisions. As your business continues to evolve, we’ll keep improving our solutions with innovations inspired by your feedback and the changing needs of the industries we serve.
Thank you for being a part of this journey. We look forward to bringing you even more meaningful updates in the months ahead.