What’s New for the Month of October 2024

We’re excited to share the latest updates to our software, reflecting our commitment to continuous improvement and innovation. This October, we’ve rolled out several enhancements. Here’s what’s new:
Pressure Gauge Monitoring for Vehicle Safety- Trakzee
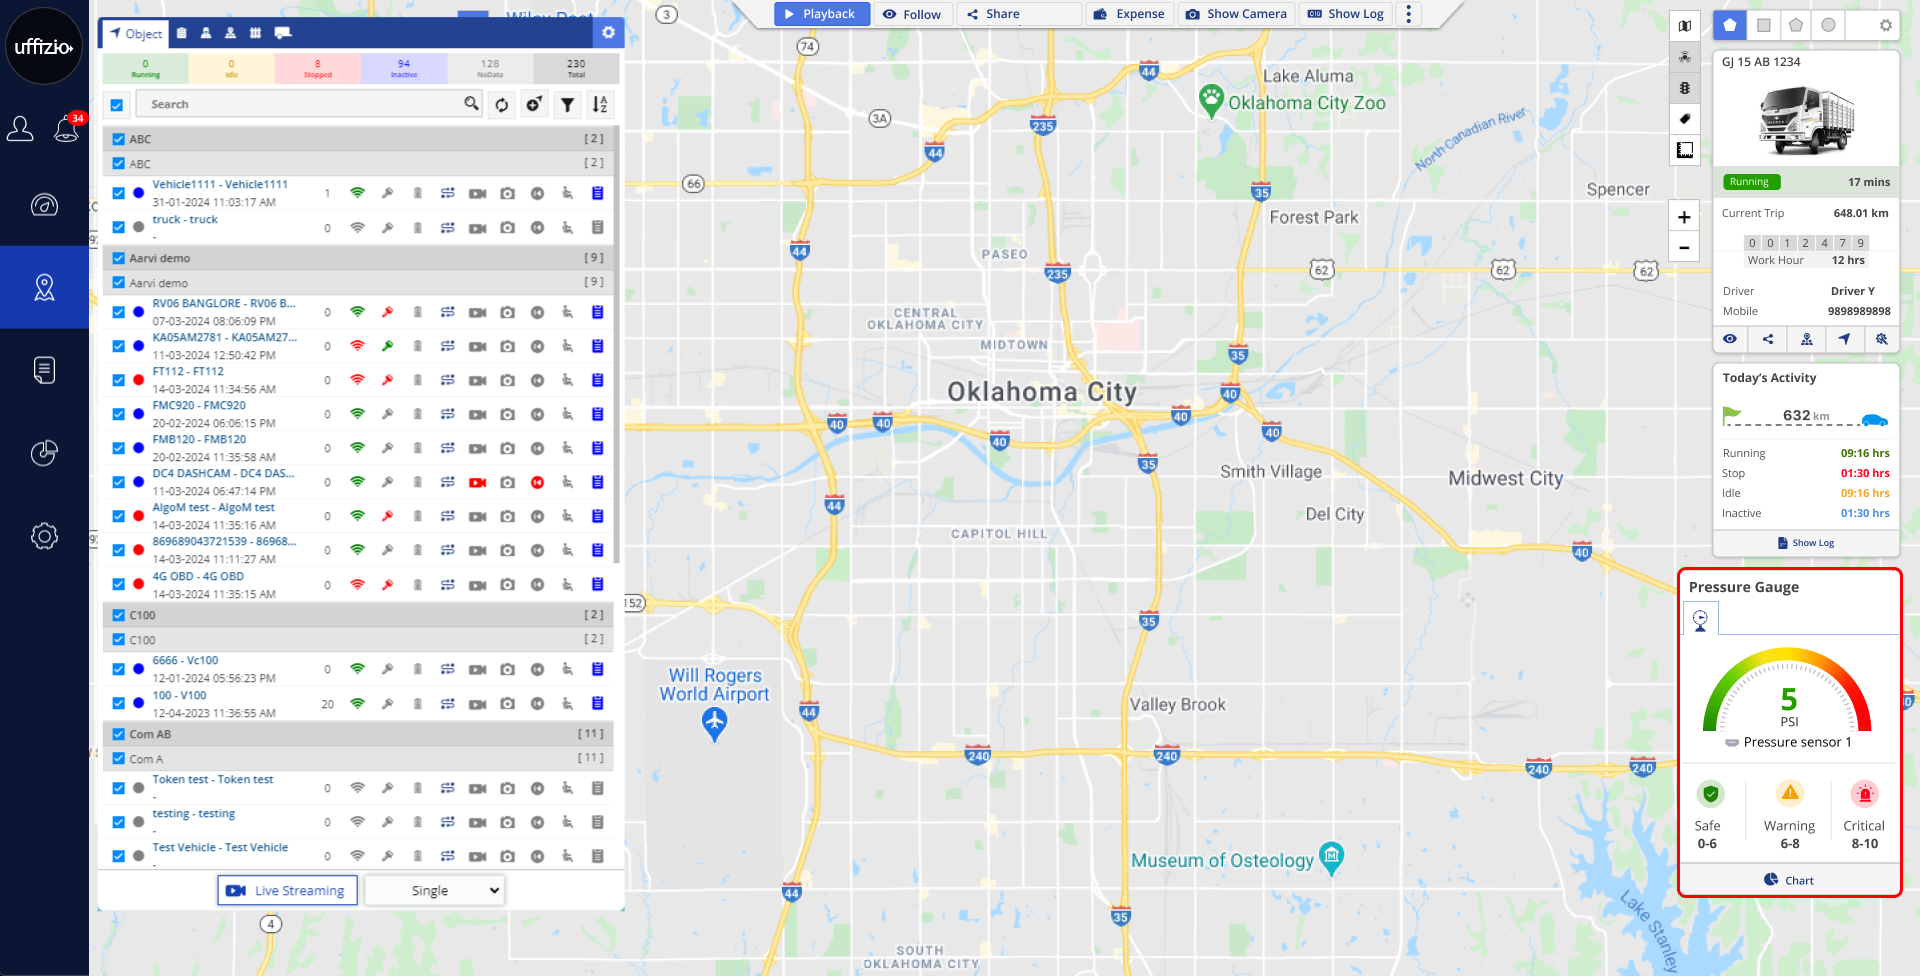
We’ve introduced a new feature that lets users monitor a vehicle’s brake pressure in real time.
This tool makes it easy to see if the brakes are working safely by showing pressure levels and alerting you if they go into a danger zone.
Key Features
- Real-Time Brake Check: See instantly if brake pressure is safe, and get a quick view of pressure levels in a simple color-coded gauge:
- Green: Safe
- Yellow: Warning
- Red: Critical
- Custom View Options: You can choose to see pressure readings in either BAR or PSI, whichever you prefer.
How It Works
For Monitoring Brake Pressure:
- Add Brake Pressure Sensor: Add a sensor in the settings to monitor brake pressure.
- Set Safe Pressure Limits: Define safe, warning, and critical levels. The system will use these to show color zones on the gauge.
- Real-Time Dashboard: On the live tracking screen, a circular gauge shows the current brake pressure and updates automatically. It will display “Safe,” “Warning,” or “Critical” based on the pressure level.
Reports and Alerts
- Brake Pressure Chart: View a 24-hour chart that shows brake pressure trends over the past day.
- Detailed Reports:
- Daily Summary Report: See each vehicle’s brake pressure data, including highest, lowest, and average readings for the day.
- Real-Time Status Report: Check the latest brake pressure readings along with the location.
- Export: Save reports as PDF or Excel files for easy sharing.
- Automatic Alerts: Set alerts to get notified by SMS, email, or app notification if brake pressure becomes critical for a set period. This helps you take action before it becomes a problem.
Why It’s Useful
- Safety First: Monitoring brake pressure helps prevent issues on the road.
- Detailed Tracking: Keep records of pressure trends to spot early warning signs.
- Custom Alerts: Be notified instantly if there’s an issue with brake pressure.
This tool helps you monitor your vehicle’s brake pressure, making it easy to keep the brakes safe and respond quickly if needed.
Elock Charging Cycle Report- Trakzee
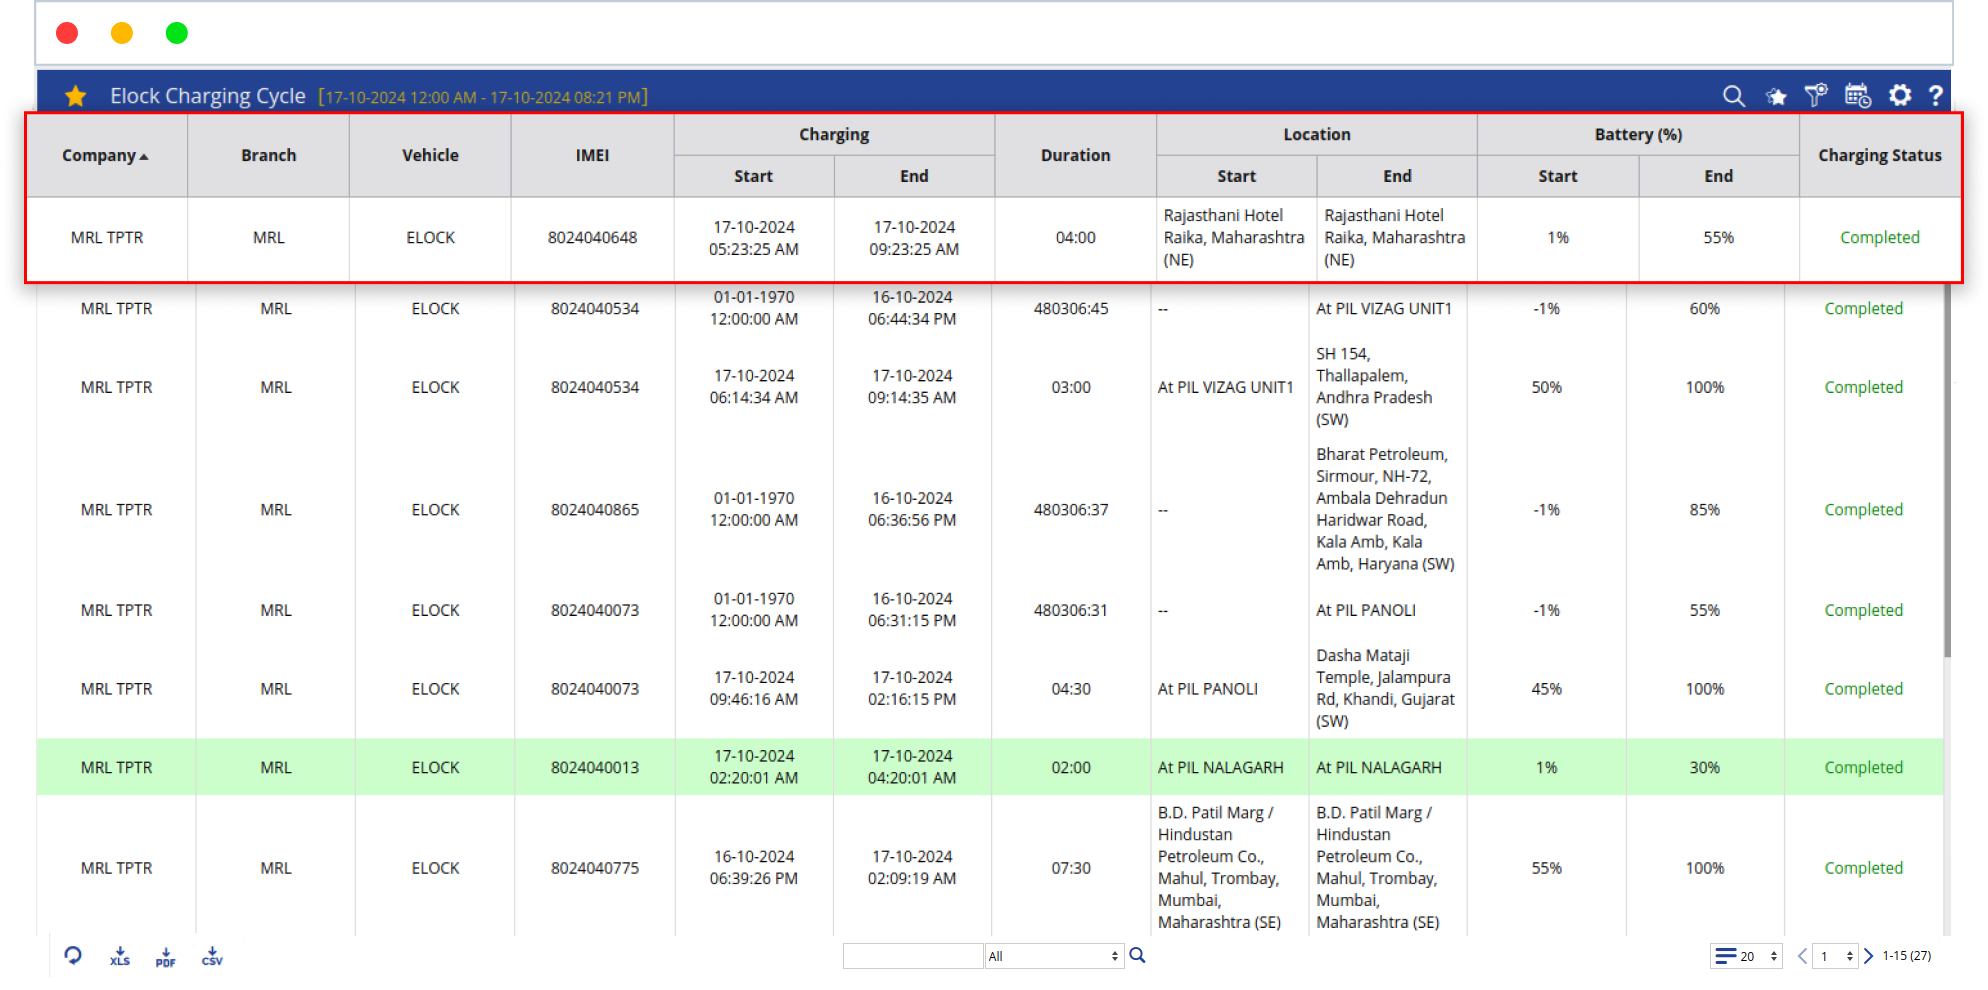
We’ve added a new report to track the charging cycles of Elock devices connected to GPS units. This report helps users understand the charging behavior of their Elock devices, including details like start and end times, battery levels, and charging duration.
Key Objectives
- Detailed Tracking: Track each Elock device’s charging process with all essential details.
- Simple Analysis: View insights into successful or incomplete charging events to ensure device reliability.
What’s Included in the Report
- Charging Details:
- Start and End Time: When charging begins and is finished.
- Battery Levels: Battery percentage at the beginning and end of charging.
- Charging Duration: How long each charging session lasted.
- Location: Where the device was located during charging.
- Charging Status: Shows if charging was “Completed” (in green) or “Interrupted” (in red).
Why It’s Useful
- Quickly Spot Issues: See if any devices didn’t charge fully so you can take action.
- Simple and Clear: Track your devices’ battery health and charging patterns at a glance.
Extra Features
- Export Options: Download your report in PDF, Excel, or CSV format.
- Scheduled Reports: Set the report to generate automatically when you need it.
This new feature makes it easy to monitor your Elock device’s charging cycles, ensuring your devices stay charged and ready to go.

