
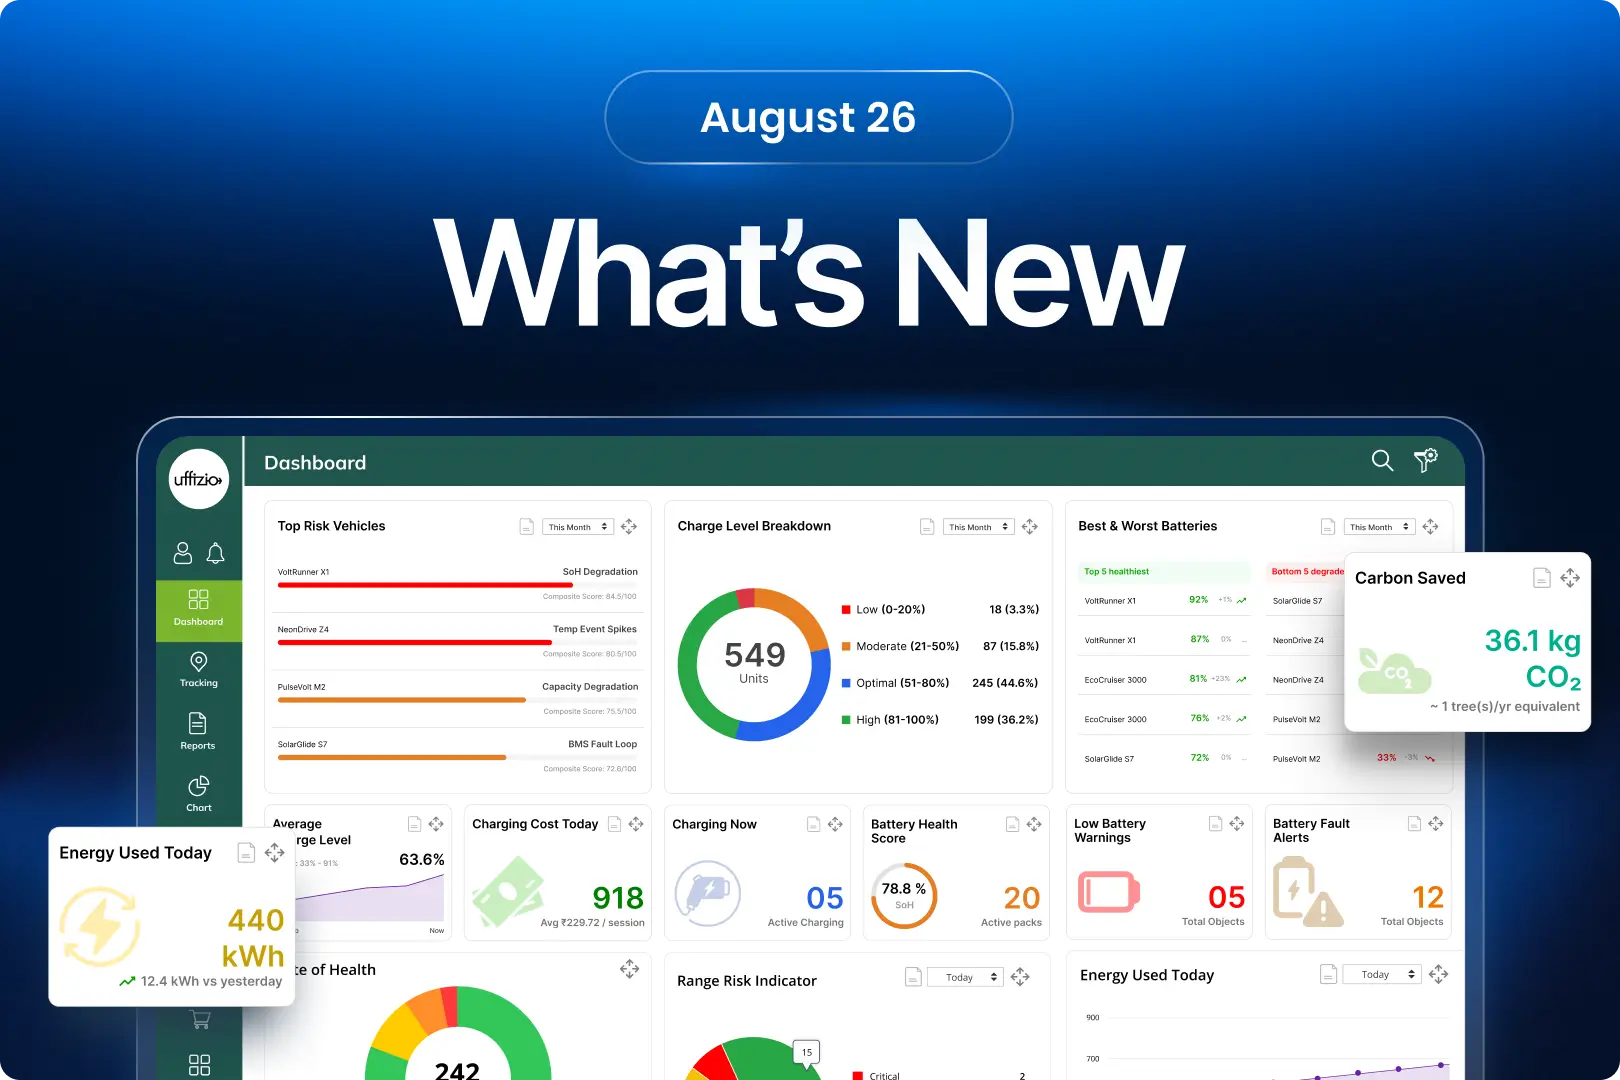
This release brings a range of meaningful enhancements designed to make fleet operations smarter, more secure, and easier to manage. From deeper EV intelligence and smarter reporting to improved scheduling, data visibility, operational controls, and privacy protection, these updates focus on turning everyday platform capabilities into greater business value for our customers and partners.
1. Trakzee updates
1.1 Taxi Meter tracking is now more flexible
Taxi fleets can use different vehicle and device configurations, which can make it difficult to maintain consistent Taxi Meter tracking across the fleet. Trakzee now makes this easier by allowing users to configure how the Taxi Meter is connected for each vehicle.
This means fleet operators can get the correct Vacant or Occupied status in Live Tracking, even when vehicles have different configurations.
What’s updated
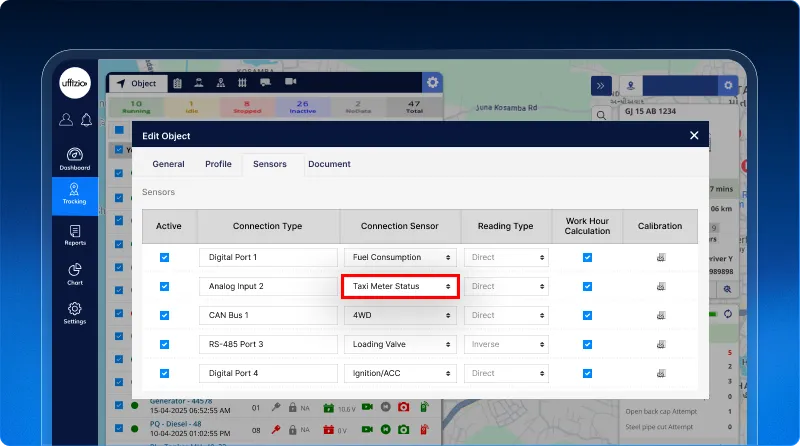
Taxi Meter can now be configured directly from the sensor settings for each vehicle.
- Select Taxi Meter as an external attachment.
- Choose the required connection for the vehicle.
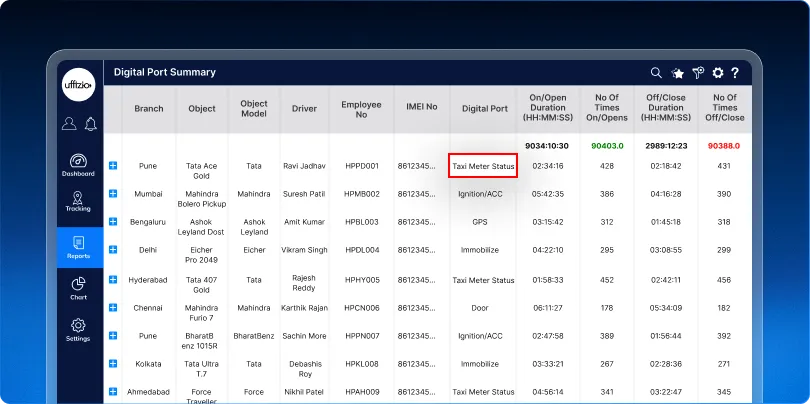
- Automatically receive the Taxi Meter status.
- View Vacant or Occupied status in Live Tracking.
- Configure different vehicles according to their individual setup.
 Key benefits
- Remove dependency on a fixed connection.
- Support different Taxi Meter installations more easily.
- Simplify configuration across vehicles and devices.
- Maintain accurate Vacant and Occupied status in Live Tracking.
- Make Taxi Meter deployment more flexible across the fleet.
 Business impact
With flexible Taxi Meter configuration, Trakzee can adapt to different vehicle and hardware setups without changing the existing Taxi Meter behavior. This makes deployment easier for fleet operators and provides a more practical solution for taxi and commercial fleet management.
1.2 Smarter EV Operations, Right from Live Tracking
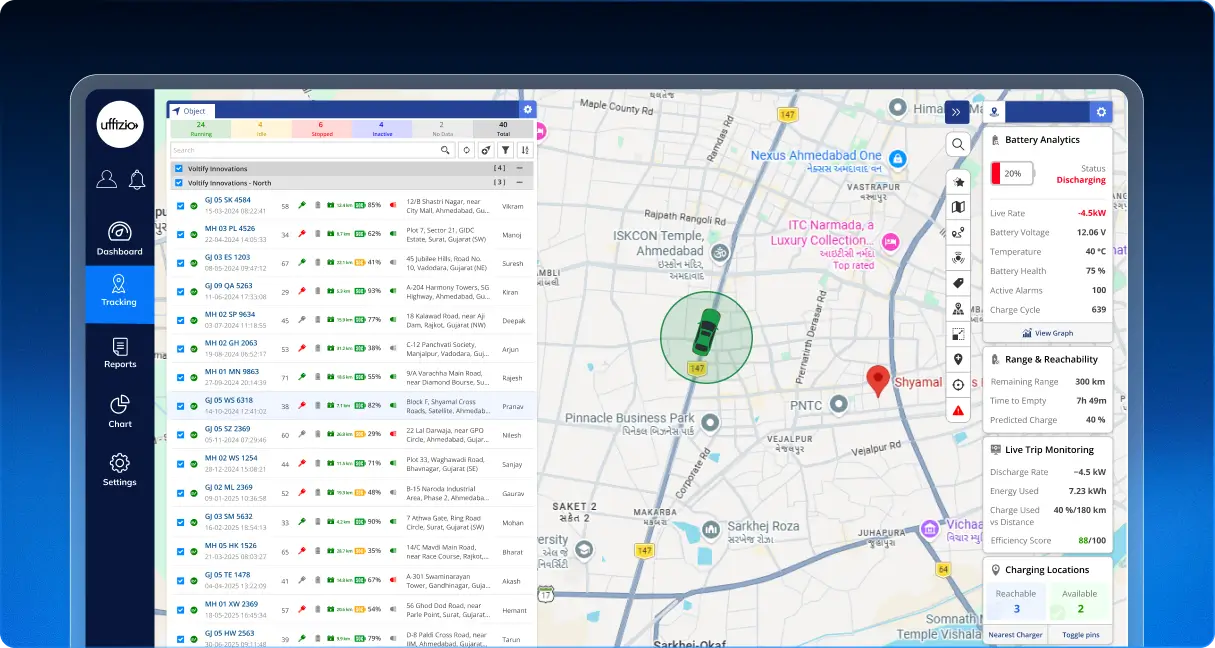
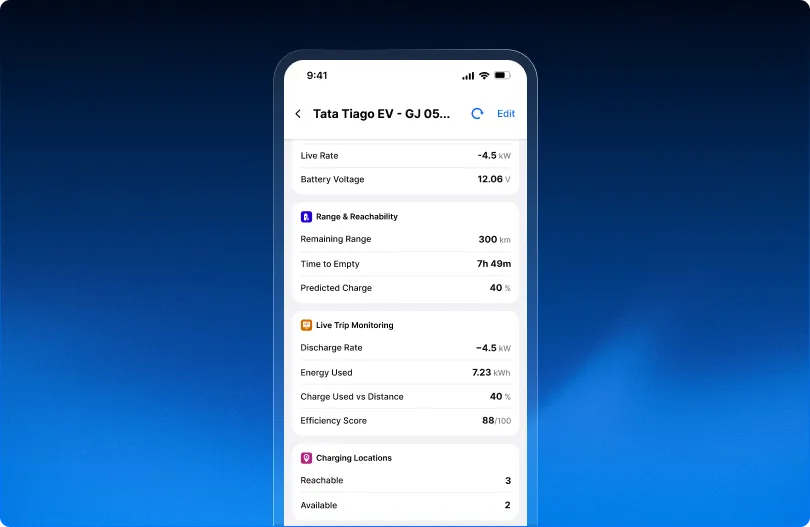
Live Tracking gets an EV-focused upgrade, bringing battery intelligence, range visibility, charging information, trip efficiency and proactive alerts directly onto the map.
Fleet managers can now get a much clearer picture of which vehicles need attention, how far they can travel, where they can charge, and how efficiently they are using energy without leaving Live Tracking.
What’s updated
- Battery visibility at a glance
Vehicle markers now surface State of Charge (SoC), with visual indicators for different battery levels and charging status. - Know how far an EV can go
Managers can view remaining range, time to empty and predicted battery level at the destination, helping identify potential range issues before they become operational problems. - Find charging options faster
Live Tracking can surface nearby charging stations, their availability and connector information, with navigation support to help teams make quicker charging decisions. - Understand energy efficiency while the trip is happening
Live trip information now provides energy consumption, charge used versus distance and an EV efficiency score, giving managers a better view of vehicle performance. - Spot battery risks before they become bigger problems
Low-battery warnings, idle battery drain indicators and critical battery alerts help teams respond proactively instead of discovering issues after a vehicle is already affected. - Focus on the EVs that need attention
Dedicated filters can help managers quickly identify low-battery vehicles, vehicles with lower battery health and vehicles currently charging. Vehicle clustering and side-by-side comparison further simplify fleet monitoring. - Look beyond the live moment
EV battery and charging information is also brought into Playback and History, making it easier to review battery behaviour and past charging activity after a trip.
Key Benefits
- Reduce range-related operational risks by knowing whether vehicles have enough charge for their journeys.
- Make charging decisions faster with charging station visibility and availability.
- Improve fleet efficiency by understanding energy consumption and trip performance.
- Act proactively on low battery, battery health and critical EV conditions.
- Reduce dependency on multiple screens by bringing critical EV intelligence into Live Tracking.
- Give fleet managers a complete EV picture from battery health and current range to charging, efficiency and historical performance.
 Why It Matters
This enhancement moves Live Tracking beyond simply answering “Where is my vehicle?”
It helps answer the questions that matter for EV operations:
“How much charge does it have?”
“Can it reach its destination?”
“Where can it charge?”
“Is it using energy efficiently?”
“Does this vehicle need attention right now?”
That makes Live Tracking a much more powerful day-to-day decision-making tool for EV fleet operations.
1.3 EV Dashboard Gets Smarter: From Battery Visibility to Fleet Intelligence
EV fleet management is not just about knowing where a vehicle is. Fleet managers also need to know how healthy the battery is, which vehicles are ready to go, what is charging, how much energy is being consumed, and which vehicles may need attention next.
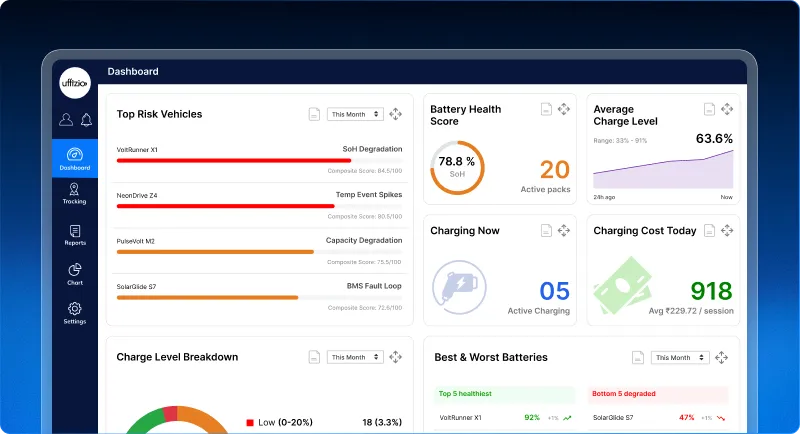
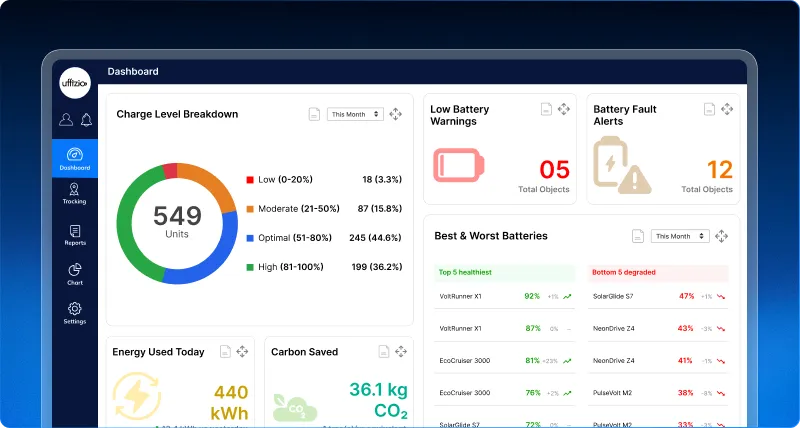
With this enhancement, the EV Dashboard is upgraded with a dedicated set of battery, charging, energy, performance, warning, and predictive insights. Instead of relying on separate reports or manually interpreting vehicle data, managers can now get a more complete picture of EV fleet health and operational readiness directly from the dashboard.
Key Benefits:
- See fleet battery health at a glance with metrics such as Battery Health Score and Average Charge Level.
- Know which EVs are ready for deployment based on their charge level and availability.
- Track charging activity and identify vehicles currently charging or waiting to become operational.
- Understand energy and charging costs with insights such as Energy Used Today, Charging Cost, and Cost per Kilometre.
- Spot battery and operational issues earlier through low-charge, fault, temperature, and other warning indicators.
- Measure EV performance and efficiency instead of looking only at vehicle location and basic telemetry.
- Get predictive visibility into battery degradation, maintenance needs, and charging completion times.
- Prioritize attention where it matters by identifying the best- and worst-performing batteries and vehicles that may require intervention.
- Reduce operational guesswork by bringing critical EV intelligence into one dashboard.
 Business Value
This enhancement moves the EV Dashboard from “Where are my vehicles?” to “How ready, healthy, efficient, and operationally viable is my EV fleet?”
For fleet managers, that means better deployment decisions, earlier intervention, tighter energy-cost control, and fewer surprises during daily operations.
In short: the dashboard doesn’t just show the EV fleet it helps managers understand what the fleet needs next.
1.4 Accurate Sleep Mode Status in Live Tracking
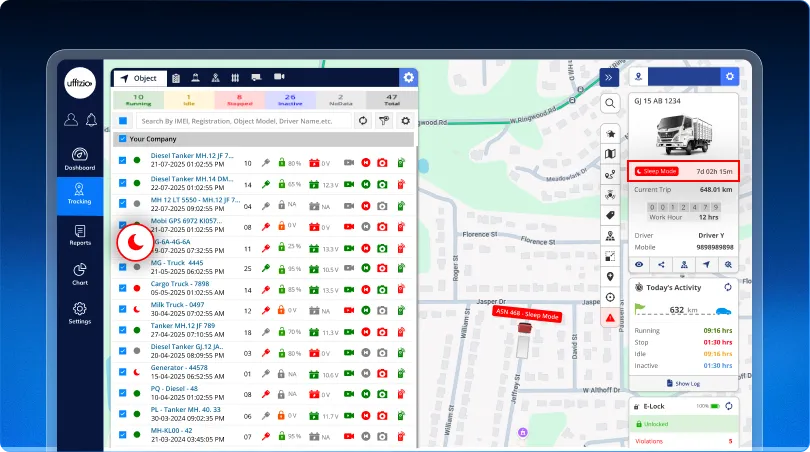
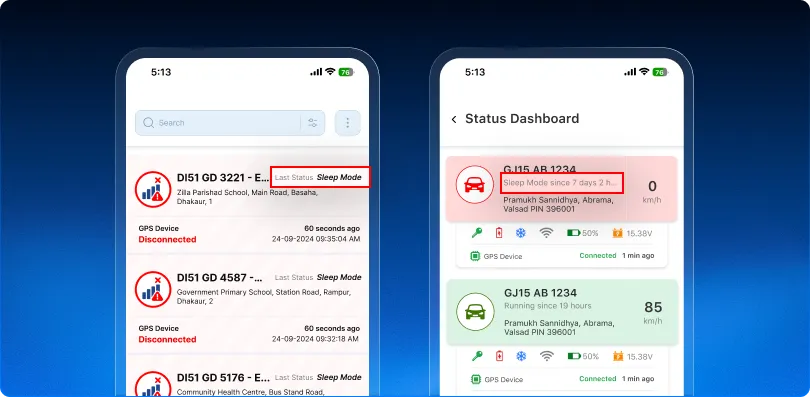
Some GPS devices go into a power-saving “sleep” mode after a vehicle has been parked for a while. This is normal, intentional behaviour — the device stays connected, it just stops sending updates to save battery. Until now, Trakzee showed these vehicles as “Stopped,” which made it look like they were simply parked, and the stop timer froze instead of counting up. Trakzee now introduces a dedicated Sleep Mode status, so fleet operators always see an accurate, real-time picture of what’s actually happening with each vehicle.
What’s Updated
- A new Sleep Mode status now appears wherever vehicle status is shown — Live Tracking list, tooltip, right-panel widget, and mobile app.
- Vehicles in sleep mode show a moon icon instead of the red “Stopped” dot.
- A “Since” field displays the exact time the vehicle went to sleep.
- The duration counter now updates live, instead of freezing at the last received packet.
- The status automatically switches back to Running, Idle, or Stopped as soon as the device wakes up and sends new data.
 Key benefits
- Removes confusion between a genuine stop and a sleep-mode stop.
- Gives fleet operators an accurate, live-updating duration instead of a frozen timer.
- Clearly distinguishes Sleep Mode from Inactive, so operators know when a vehicle actually needs attention.
- Keeps status current across web and mobile without manual refresh.
 Business impact
With accurate Sleep Mode reporting, Trakzee removes a recurring source of customer confusion and support tickets around stop-duration data. This builds more trust in the platform’s live tracking accuracy — a stronger point for any fleet management pitch.
1.5 Turn alert history into actionable trends
Introduction
Alerts can tell you when something went wrong, but looking at individual alerts makes it difficult to understand whether a vehicle’s alert activity is improving, increasing, or following a recurring pattern. Trakzee now makes it easier to look at alert history over time and understand where alerts are coming from.
Key enhancements
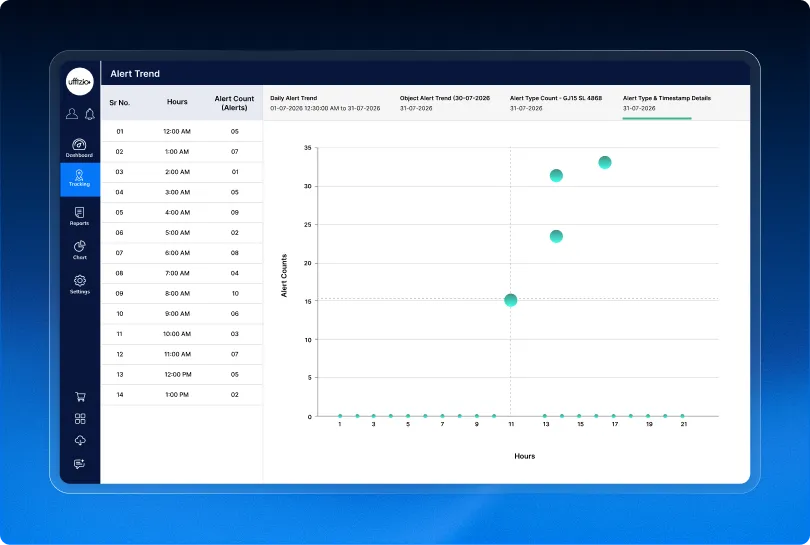
The new Alert Trend Chart provides a visual way to analyse historical alert activity for selected objects.
- Analyse alert trends on a Daily, Weekly, or Monthly basis.
- Select multiple alert categories and up to 10 objects.
- Drill down from overall alert trends to object, alert type, and individual alert details.
- View alert occurrences with their timestamps for deeper analysis.
- Export the chart and drilldown data using the existing PDF export functionality.
 Key benefits
- Identify recurring alert patterns over time.
- Understand which vehicles contribute to higher alert volumes.
- Analyse the alert types affecting specific vehicles.
- Move from a high-level trend to individual alert details quickly.
- Support more informed fleet monitoring and corrective actions.
Business impact
The Alert Trend Chart gives fleet managers a clearer picture of historical alert behaviour instead of relying only on individual alert records. By identifying recurring patterns and the vehicles or alert types behind them, teams can take more informed steps to improve fleet safety, compliance, and operational performance.
1.6 Reports That Remember Your Preferences
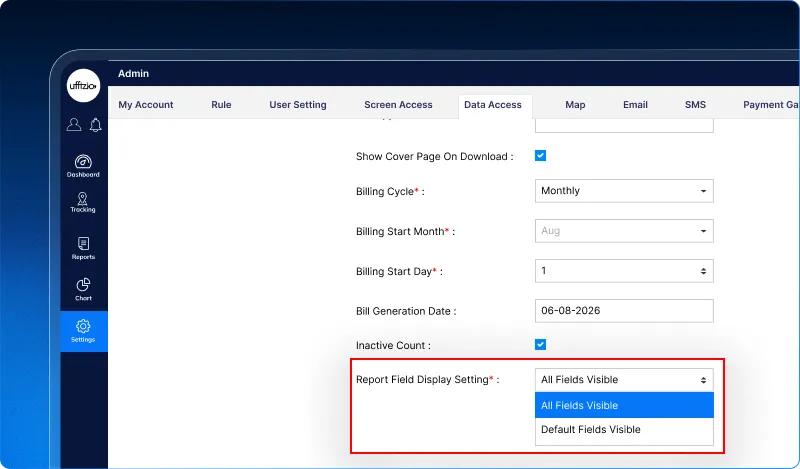
Not every user needs the same information from a report. Showing too many columns can make important details harder to find and reports difficult to read. Trakzee now makes Trip and Travel Reports more flexible by allowing users to start with the fields they need and customise the report to match the way they work.
A smarter report experience
With the new report customisation options, users can:
- Start with predefined default fields instead of seeing every available field.
- Add or remove fields based on their requirements.
- Resize columns for a clearer and more comfortable view.
- Save their customised field and column settings for future use.
- Keep their existing report preferences without being affected by new default settings.
 Why it matters
- Less clutter and easier report reading.
- Important information is easier to find.
- New users get a cleaner report view from the start.
- Each user can personalise the report to their needs.
- Saved preferences mean less repetitive setup.
Business impact
Trakzee makes reporting more personal and practical. Instead of making every user work around the same report layout, Trip and Travel Reports can now adapt to individual viewing preferences—helping teams spend less time managing columns and more time using the information that matters.
1.7 A Smarter Way to Read Vehicle Locations
Knowing a vehicle’s address is useful. Knowing which defined area it was in makes that information even more valuable.
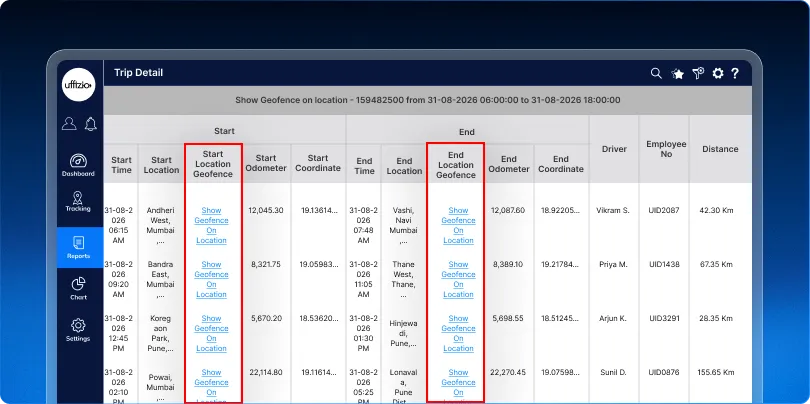
With this enhancement, Trakzee can now use configured geofences to add more context to locations shown in Trip and Travel Reports. When enabled, the report can identify the geofence associated with a vehicle’s location, helping users understand not just where a trip started or ended, but which operational area it happened in.
The system intelligently handles overlapping geofences by showing the most recently entered geofence, while locations without a matching geofence are marked as NA.
This gives fleet teams a clearer picture of vehicle movement without changing how addresses or geofences are created.
What’s better?
- View the relevant geofence alongside trip locations.
- Get clearer context for Start and End Locations.
- Handle overlapping geofences intelligently.
- Enable the feature only when required through Data Access settings.
- Available for eligible Trakzee Premium projects due to the additional processing involved.
 The result
Trip reports become more than a record of addresses they provide location context that helps teams understand where operations actually happened.
1.8 Control Device Commands with Greater Precision
Fleet operations often involve different customers, device types, and operational requirements. But giving every operator access to every predefined device command can create unnecessary risk and confusion.
With this enhancement, Trakzee gives admins greater control over which predefined SMS and GPRS commands operators can access for each customer and device type. Admins can now configure command access based on the specific requirements of a company and its devices. This means operators only get access to the commands they actually need while other commands remain restricted.
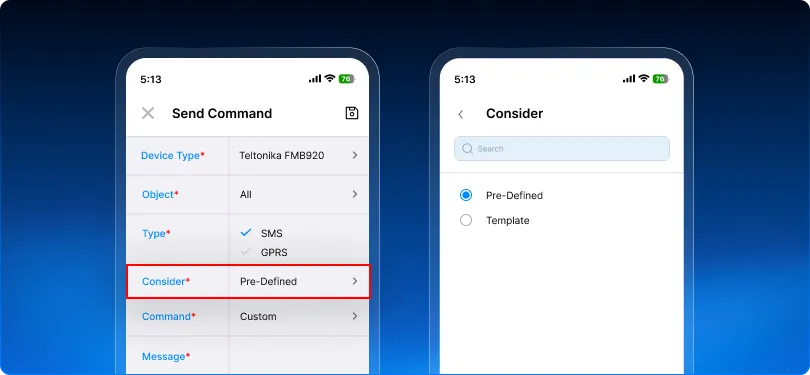 Why this matters for your business
For system integrators and resellers, this adds another layer of customer-specific control and security to the platform.
You can now:
- Configure different command access for different customers.
- Control command availability based on device type.
- Restrict sensitive or unnecessary commands from operators.
- Deliver a more tailored platform experience for each customer.
- Maintain existing command behaviour for customers who don’t need restrictions.
A small configuration enhancement, but a valuable step towards more controlled and customer-specific fleet operations.
1.9 Make Every QR Scan Count
A QR code can be scanned from anywhere, but some actions need to happen at the right place. To make driver check-ins more reliable, Trakzee can now validate whether the driver is actually near the assigned vehicle before allowing a QR scan.
What’s new
A new Proximity Validation for QR Scan setting allows admins to define how close a driver must be to the vehicle to scan its QR code. When enabled, Trakzee compares the driver’s GPS location with the vehicle’s latest location and allows the scan only when the driver is within the configured radius.
If the driver is outside the allowed distance, the scan is blocked with a clear message asking them to move closer to the vehicle.
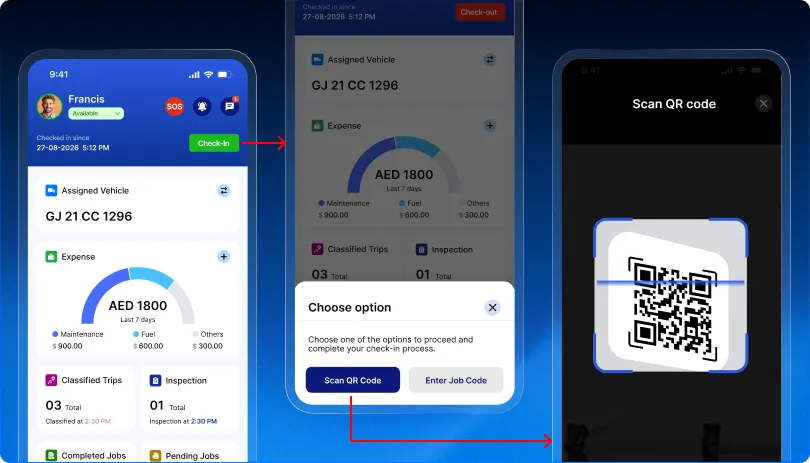 Why it matters
This adds an extra layer of location-based validation to driver check-ins and helps prevent QR codes from being scanned remotely or used for incorrect validations.
For system integrators and resellers, it creates an opportunity to offer customers more secure and accountable driver operations, especially where accurate vehicle-level check-ins are important.
A simple GPS-based check that turns a QR scan into a more trustworthy validation.
1.10 Find what you need faster with a smarter menu structure
As applications grow, so does the number of features users need to access. When too many options appear at the same level, navigation can quickly become crowded and harder to follow.
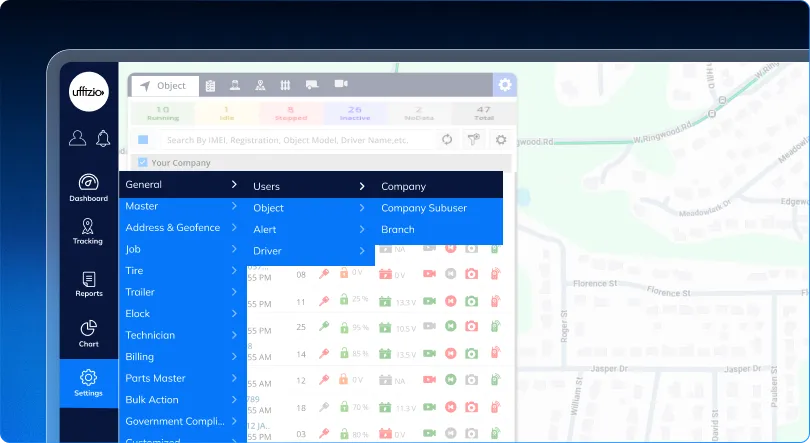
This enhancement introduces a three-level menu structure that organizes related features into clear categories and sub-categories. The result is a cleaner interface where users can find the right feature more quickly and navigate the application with less confusion.
What’s updated
- Three-level navigation for better organization.
- Main modules remain at the first level.
- Related features are grouped into second-level sub-categories.
- Detailed options are placed under the third level.
- Existing screens are reorganized into logical categories.
- Existing screen rights and account-level access continue to be supported.
 Why it matters
- Less clutter: A cleaner menu makes the application easier to understand.
- Faster access: Users can locate the required feature without scanning through a long list.
- Better usability: Related functionality stays together, making navigation more intuitive.
- Easier to scale: New features can be added within the right category instead of making the main menu longer.
Business value
A well-structured menu does more than improve the interface—it makes a feature-rich application easier to adopt and operate. As more capabilities are added, users can continue to navigate the platform comfortably without feeling overwhelmed by the growing number of options.
More features, less menu clutter. That’s the real value of this enhancement.
1.11 Before You Delete, Know What’s at Stake
Deleting a record should be simple but it shouldn’t come with the risk of accidentally losing important linked information.
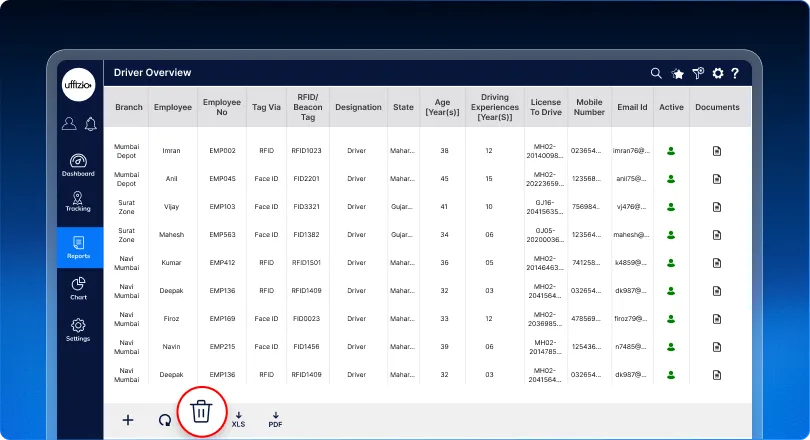
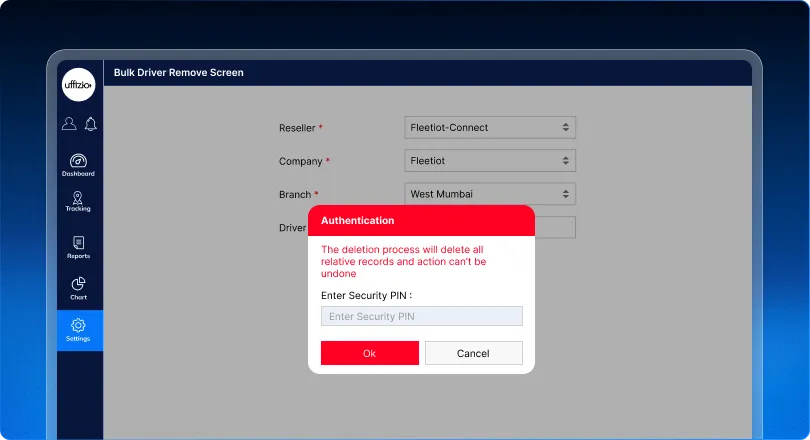
With this enhancement, the system now gives users a clear warning before a deletion that can impact related data. It also adds an additional security check for bulk deletions, making important data safer from accidental or unauthorized actions.
 What’s updated
Before deleting a record that can affect related information, users will now be shown what the deletion could impact.
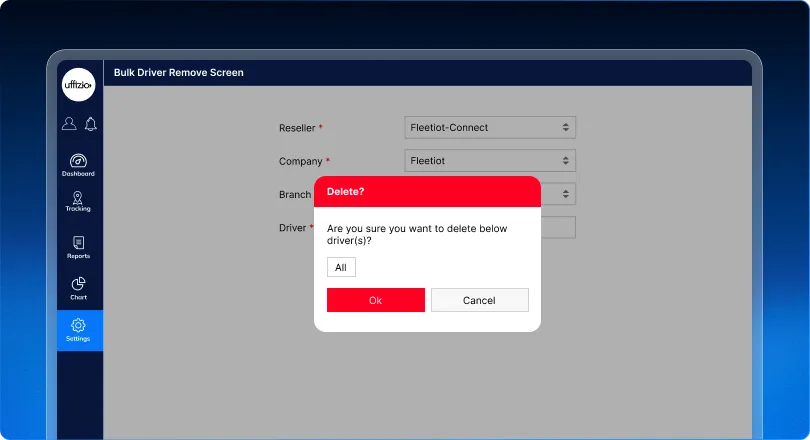 For example, deleting a Driver can also remove the driver allocation linked to trips. Instead of finding this out later, users get the warning before they confirm the deletion.
For bulk deletions, the system also requires Security PIN/password verification before the action is completed.
 Why This Is Valuable
- Reduce accidental data loss by making the impact visible before deletion.
- Make better decisions with clear information about linked data.
- Add an extra layer of security for bulk deletion actions.
- Protect important operational records such as trip and driver information.
- Create a safer deletion experience across important entities such as Drivers, Geofences, Addresses, and Alerts.
The Business Value
This enhancement turns deletion from a simple “Are you sure?” into a more informed decision.
Users can now understand the impact, confirm the action, and delete with confidence helping prevent avoidable data loss while keeping control in the hands of the right users.
Because sometimes, knowing what you’re about to delete is just as important as being able to delete it.
1.12 See the Risk. Find the Right Contact. Take Action
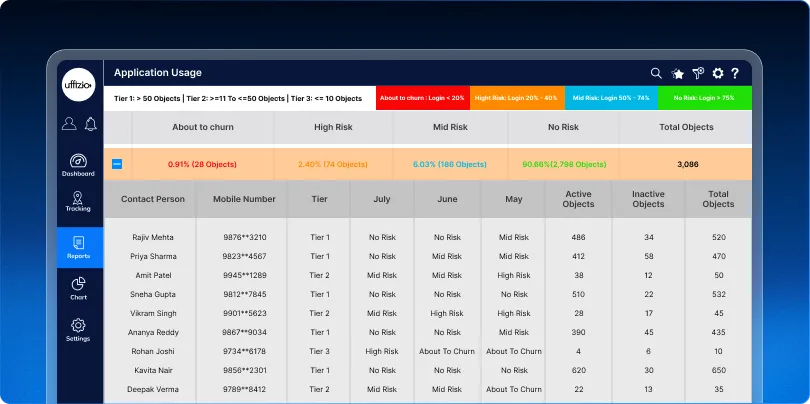
The Application Usage Report already helps teams identify companies that are At Risk, Mid Risk, or About to Churn. But spotting a risk is only the first step—the real value comes from being able to act on it quickly.
With this enhancement, Contact Person and Mobile Number are now available directly within the Application Usage Report. In the Summary view, users can see the relevant Reseller contact details, while the Detail view provides the Company contact details. The same information is also available in exported reports.
 Why This Matters
- Act on risks faster — identify an account at risk and immediately know whom to contact.
- No more switching between modules — contact information is available right alongside the usage insights.
- Speed up follow-ups — reduce the time spent searching through master data.
- Make risk monitoring actionable — turn usage signals into timely customer conversations.
- Take the information with you — contact details are also included in exported reports.
The Business Value
The report now connects “Who needs attention?” with “Who should we talk to?”
That means teams can move from identifying usage risks to taking action faster and with less effort helping them stay ahead of potential churn and improve customer engagement. Spot the signal. Find the contact. Start the conversation.
1.13 One Reporting View for Complete EV Fleet Intelligence
Managing an EV fleet requires much more than tracking vehicle movement. Fleet managers need to understand battery health, charging behaviour, energy consumption, operating efficiency, safety incidents, maintenance risks, and vehicle availability to make better decisions.
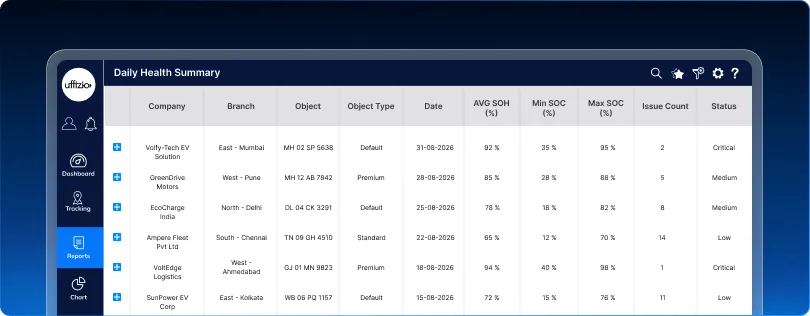
This enhancement introduces a dedicated EV Reports section in Trakzee Premium with 35 purpose-built reports organised across seven areas: Battery Health, Charging, Energy & Cost, Efficiency, Safety & Incidents, Predictive, and Operations.
The new reports bring EV-specific intelligence into the existing reporting ecosystem, so teams no longer need to depend on separate BMS systems or manual data extraction to understand the health and performance of their electric fleet.
 Key Benefits:
- Track battery health over time with reports covering SoH, battery ageing, charge/discharge cycles, health history, and battery inventory.
- Understand charging behaviour through charging sessions, charging habits, off-peak compliance, charging locations, and station usage reports.
- Measure the real cost of running an EV fleet with energy consumption, charging cost, cost per kilometre, budget vs. actual, energy recovered, and carbon savings insights.
- Identify efficiency gaps across vehicles, drivers, and usage patterns with range efficiency, battery usage, idle drain, and driver impact analysis.
- Spot battery-related risks early through dedicated reports for battery alarms, deep discharge, overcharging, overheating, and incident investigation.
- Move from reactive to proactive maintenance with failure prediction, service recommendations, risk score breakdown, and replacement forecasting.
- Monitor fleet readiness and operational availability through fleet availability, downtime, warranty status, data gaps, and compliance reporting.
- Make reporting part of the existing workflow with Excel, PDF, and CSV exports, along with scheduled report delivery through the existing Trakzee reporting framework.
- Get one unified view of EV operations instead of switching between fleet reports, BMS platforms, spreadsheets, and manual analysis.
Business Value
This enhancement turns EV data into actionable fleet intelligence.
Managers can now answer questions like “Which batteries are degrading?”, “Where are we spending the most on charging?”, “Which vehicles are least efficient?”, “Which batteries are becoming risky?”, and “Which vehicles may need maintenance or replacement?” — using reports within the same platform.
In short: EV reporting moves from simply recording what happened to helping fleet teams understand what it means and what they should do next.
1.14 Respect Camera Privacy with Automatic Privacy Mode Controls
Camera privacy is critical when vehicle video systems are deployed in environments where privacy regulations apply.
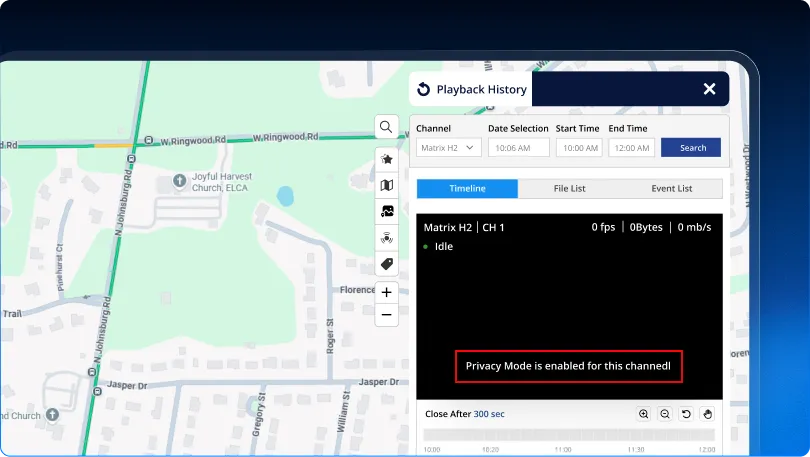
With this enhancement, Trakzee now recognizes Privacy Mode received from supported Streamax devices and automatically restricts access to camera channels marked as private.
When Privacy Mode is enabled for a camera channel, users will no longer be able to live stream, playback, or capture snapshots from that channel. The restricted camera will be clearly indicated with an inactive/red status and a “Privacy Mode On” message.
The restriction is applied automatically based on the device status, so administrators and users do not need to take any manual action. The enhancement also improves handling of inactive devices by preventing users from being stuck on a continuously buffering stream and displaying a clear “Device inactive” message instead.
 Key Benefits:
- Strengthens privacy compliance by preventing access to camera feeds when Privacy Mode is enabled.
- Prevents unauthorized video viewing by automatically restricting private camera channels.
- Protects privacy across Live Tracking, Playback and Snapshot instead of limiting the restriction to live video only.
- Provides clear visibility into why a camera feed is unavailable through Privacy Mode status messaging.
- Works automatically based on the Privacy Mode status received from the device, reducing manual intervention.
- Keeps unrestricted cameras working normally, so privacy controls do not affect other available feeds.
- Creates a better user experience for inactive devices by showing “Device inactive” instead of leaving users with a continuously buffering stream.
- Extends privacy protection across Web and Mobile, providing consistent access control wherever camera feeds are viewed.
Business Value
This enhancement gives organisations greater control over camera privacy while maintaining uninterrupted access to permitted video feeds.
For businesses operating in privacy-sensitive environments, it adds an important layer of protection: when a camera is marked private at the device level, the platform respects that decision automatically.
2. Smart waste Updates
2.1 Turn reopened complaints into a service-quality signal
Closing a complaint may look like the end of an issue. But when the same complaint has to be reopened, it tells a different story the issue may not have been fully resolved the first time.
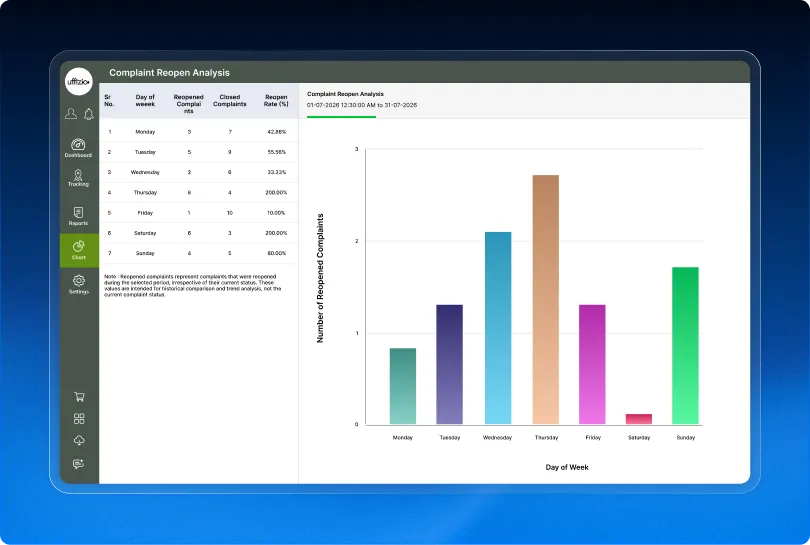
The new Complaint Reopen Analysis Chart gives managers a simple way to spot these patterns across weekdays and then see which wards are contributing to them. This helps turn complaint reopenings into a measurable service-quality indicator rather than leaving them buried in complaint records.
What’s updated
- Weekday-wise reopen analysis to identify days when complaints are more frequently reopened.
- Reopen Rate (%) to put reopened complaints in context of the total complaints received.
- Ward-wise drill-down to identify areas contributing to higher reopen rates.
- Interactive analysis that lets managers move from a high-level weekday trend to the underlying ward-level pattern.
- Exportable insights using the existing Charts functionality.
 Why it matters
A high number of reopened complaints can be an early signal of incomplete resolution, recurring service issues, or operational gaps.
With this view, managers can:
- Identify recurring high-reopen days.
- Spot wards where complaint resolution may need closer attention.
- Compare reopened complaints against total complaints instead of looking at raw numbers alone.
- Identify areas where corrective action or better resolution practices may be required.
Business value
This enhancement helps SmartWaste move from simply tracking how many complaints were received to understanding how effectively those complaints were resolved. For waste-management operators, that means better visibility into service quality, more focused operational reviews, and an opportunity to reduce repeated complaints over time.
Because a complaint marked “resolved” isn’t necessarily a complaint truly solved.
2.2 See where your collection revenue is coming from
Knowing the total amount collected is useful. Knowing where that revenue is being generated is even more valuable.
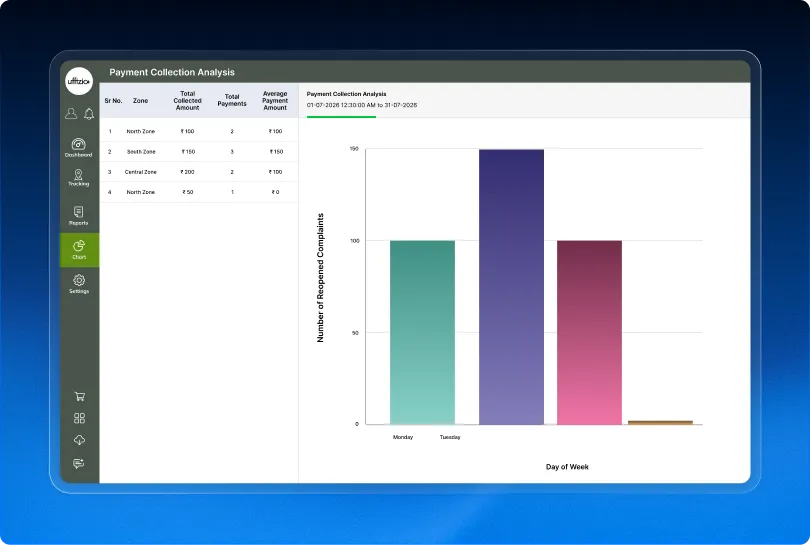
The new Payment Collection Analysis Chart gives SmartWaste managers a geographical view of payment performance, making it easier to compare Zones and then drill down into individual Wards. Instead of going through reports to find revenue patterns, managers can quickly see which areas are performing strongly and which may need attention.
What’s updated
- Zone-wise revenue analysis to compare payment collection across operational areas.
- Ward-level drill-down to understand the performance of a selected Zone.
- Total Collected Amount to see the revenue generated from each area.
- Total Payments to understand payment volume alongside revenue.
- Average Payment Amount to add more context to collection performance.
- Interactive charts and tables for quicker analysis.
- Exportable insights using the existing Charts functionality.
 Why it matters
A Zone collecting ₹10 lakh through 1,000 payments tells a different story from a Zone collecting ₹10 lakh through 5,000 payments.
By looking at revenue, payment volume and average payment value together, managers get a much clearer picture of how payment collection is performing across different areas.
This can help them:
- Identify high-performing revenue areas.
- Spot Zones or Wards with lower collection performance.
- Compare payment volume with actual revenue.
- Focus operational efforts where they can have the most impact.
- Make better decisions around revenue collection and area-level performance.
Business value
This enhancement turns payment data into a geographical revenue intelligence tool.
For waste-management operators, it creates a clearer understanding of where collection revenue is coming from and where there may be room to improve. For solution providers, it adds a strong analytics capability to the SmartWaste proposition helping position the platform as more than an operational tool, but as a platform that supports better financial and operational decision-making.
From “How much did we collect?” to “Where are we collecting it?” that’s the real upgrade.
2.3 Turn One Dashboard into Multiple Workspaces
Managing different parts of a waste operation often means looking at different sets of information. Fleet managers may want vehicle performance, while operations teams may focus on jobs, complaints, or workforce activity.
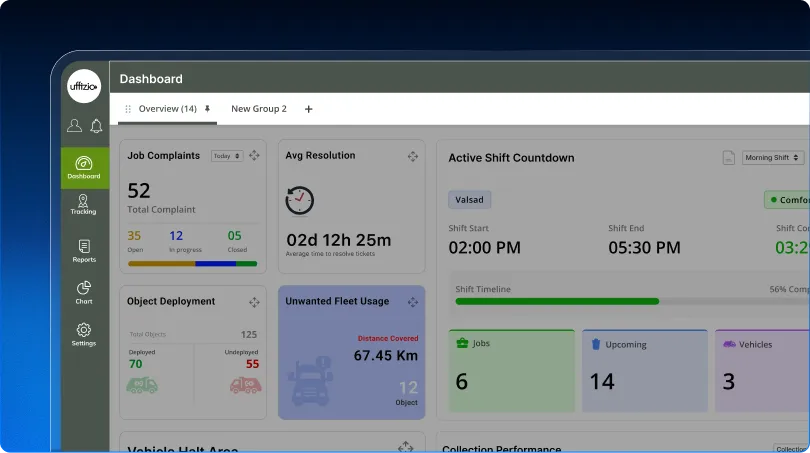
With the new Dashboard Tabs enhancement in SmartWaste, users can now create multiple personalized dashboard views, each focused on a specific operational need.
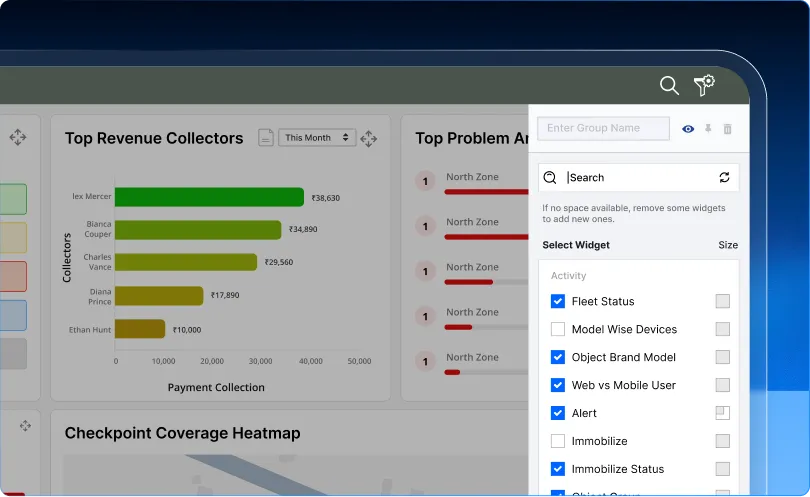 Users can create up to 6 dashboard tabs, choose the widgets they need for each view, name the tabs, reorder them, and set a default tab. Existing dashboard configurations are also carried forward, so users can start using the new experience without losing their current setup.
 Why it matters
- Create purpose-driven dashboards for different operational activities.
- Keep important information organized instead of putting every widget on one screen.
- Switch between views instantly without leaving the dashboard.
- Give teams a more focused view of the information relevant to their responsibilities.
- Reuse and customize views easily by creating tabs from existing categories or duplicating another tab.
- Maintain consistency across teams with dashboard configurations inherited by eligible sub-users.
A dashboard that adapts to the way you work
Whether the focus is fleet operations, job execution, alerts, complaints, or overall performance, users can now keep each view focused and relevant.
One dashboard no longer has to do everything. Create the view you need, when you need it.
2.4 Separate actual jobs from unauthorized movement
Vehicle Job Summary reports can sometimes include Unauthorized Movement records when a vehicle starts moving before its scheduled job time. While these events are important operationally, they don’t represent actual waste collection jobs.
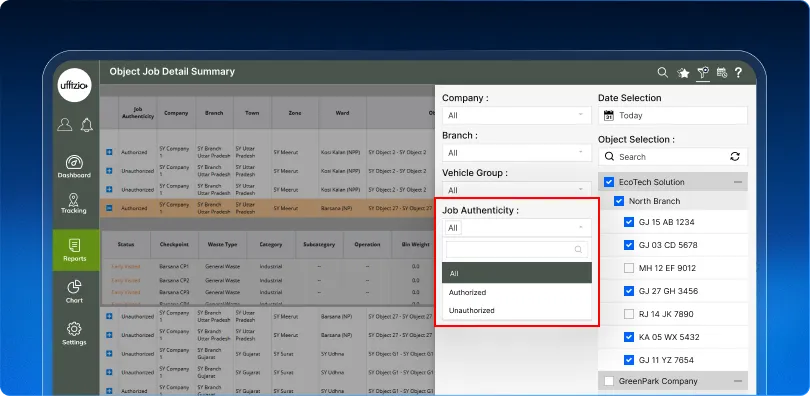
With the new Job Authenticity filter, SmartWaste gives users more control over how job data is viewed and reported. Users can now choose whether to include All, Authorized, or Unauthorized records when generating the Vehicle Job Summary Report.
 Why it matters
- Get a more accurate job count by separating actual jobs from unauthorized movement events.
- Focus on genuine collection activity when reviewing operational performance.
- Keep unauthorized movements visible when they are needed for operational monitoring.
- Maintain existing reporting behaviour with All selected by default.
- Carry the same filtering logic into exported and scheduled reports.
More meaningful job reporting
Not every movement is a job. With Job Authenticity, managers can choose the data that best fits their reporting needs whether they want the complete picture or only genuine collection jobs.
More control over the report. More meaningful operational insights.
2.5 Manage Your Collector Workforce Smarter
Managing a large number of collectors can become time-consuming when every update has to be handled individually. Administrators also need a simple way to control collector access without losing the historical records associated with them.
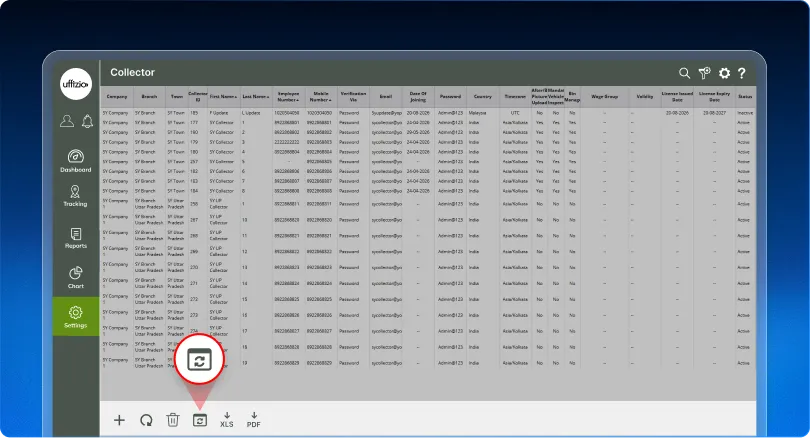
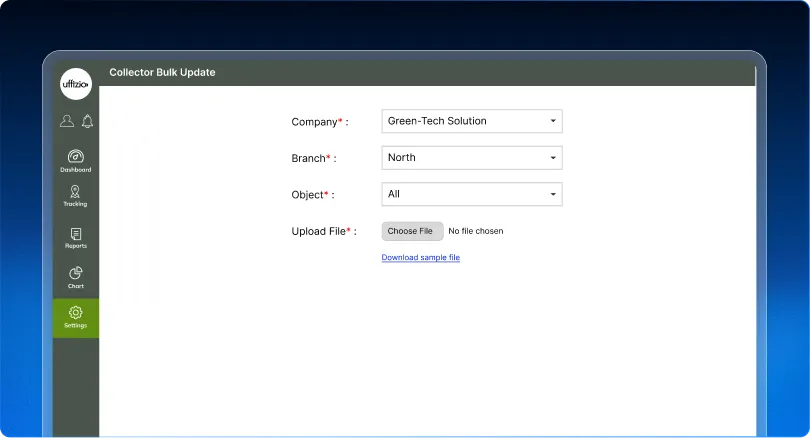
With the new Collector Management enhancements, Smart Waste makes it easier to manage the workforce at scale. Administrators can now activate or deactivate collectors, update multiple collector records together, or remove multiple records when required—all while keeping historical operational data intact.
 Why it matters
- Save administrative time by updating multiple collector records in one go.
- Control app access by marking collectors as Active or Inactive without deleting their records.
- Prevent operational errors by ensuring inactive collectors cannot be assigned to new jobs.
- Keep historical data intact so past collections, jobs, and reports remain available.
- Simplify workforce management with bulk update and bulk delete capabilities.
- Get better visibility into the current status of your collector workforce.
 More control. Less manual work.
Managing a growing field workforce shouldn’t mean managing every record one by one. These enhancements give administrators the control they need to keep collector information current, access secure, and day-to-day operations running smoothly.
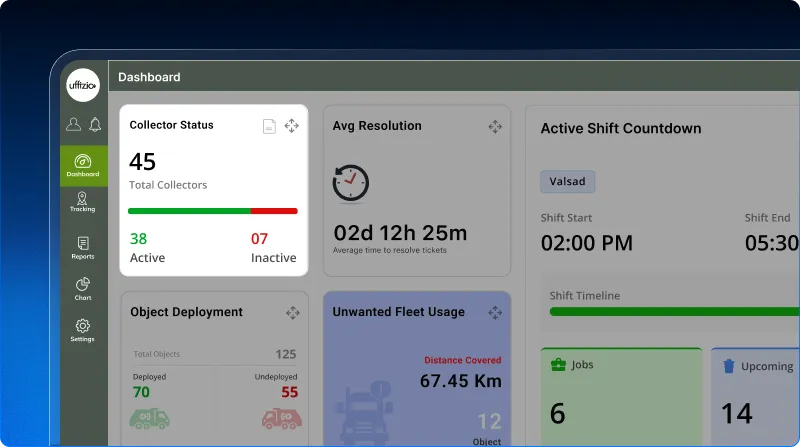
2.6 Know Your Workforce at a Glance
Managing field operations becomes much easier when managers can quickly see who is active, who is inactive, and what work is currently assigned to them. Previously, collector information and job allocation had to be checked across different areas of the application.
The new Collector Status dashboard widget brings this information together in one place, giving managers a clear view of the collector workforce within their selected operational hierarchy.
 Why it matters
- See workforce availability instantly with Total, Active, and Inactive collector counts.
- Identify inactive collectors quickly instead of manually checking individual records.
- Understand current workload by seeing the jobs allocated to each collector.
- Spot operational gaps where inactive collectors may still have active job allocations.
- Get location-wise visibility across Company, Branch, Town, Zone, and Ward.
- Make faster operational decisions with workforce information available directly from the dashboard.
- Take the information with you through XLS and PDF export options.
From scattered information to one clear view.
The Collector Status widget gives managers a simple way to understand workforce availability and current job allocation without jumping between modules. It turns everyday collector information into a practical operational view that can help teams respond faster and manage field resources more effectively.
2.7 Set Your Own Rules for Survey Data
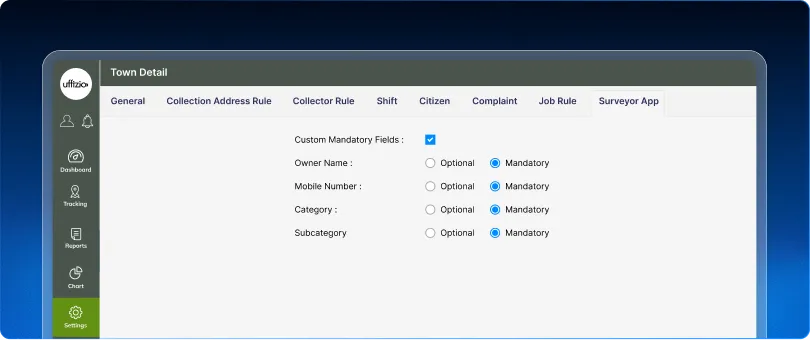
Every Smart Waste project has different data requirements. While one project may need the Owner Name and Mobile Number, another may consider Property Type or Category more important.
With this enhancement, administrators can now decide which survey fields should be mandatory for their project without changing the application.
 Business Value
This gives project teams greater control over data quality and survey completeness. By making critical fields mandatory, administrators can ensure surveyors capture the information needed for downstream activities such as citizen services, reporting, and property management.
What’s updated
Custom Mandatory Field Configuration is now available in the Town Configuration. Administrators can configure the following fields as Mandatory or Optional:
- Owner Name
- Mobile Number
- Category
- Subcategory
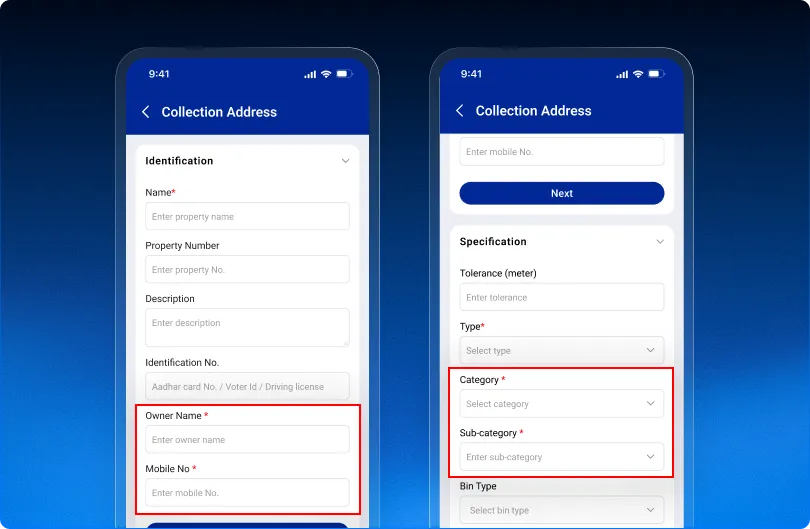 Once configured, the Surveyor Mobile App will automatically validate the selected fields before allowing a survey to be saved or submitted.
The configuration also works for offline surveys, ensuring the same data-quality rules continue to apply even without an active internet connection.
Why It Matters
This enhancement makes survey data more complete, consistent, and project-specific.
Whether a project needs basic property information or detailed citizen and category data, administrators can now set the rules according to their operational requirements giving every Smart Waste deployment the flexibility it needs.
Better configuration leads to better data and better data leads to better decisions.
2.8 Turn Complex Schedules into Simple Plans
Waste collection operations don’t always follow the same route every day. A vehicle may need to cover different areas on different days, visit certain checkpoints at regular intervals, or perform services on specific dates each month.
This enhancement makes Job Planning more flexible by allowing teams to plan these schedules in advance instead of making manual changes whenever the route changes.
Business Value
With more control over when and where vehicles operate, teams can plan routes around their actual operational requirements.
This helps reduce manual planning, keeps daily routes more accurate, and ensures that Live Tracking reflects only the areas and locations scheduled for that day.
It is especially valuable for large-scale operations such as Bin Washing, where thousands of bins need to be distributed across routes and serviced according to a predefined monthly schedule.
What’s added
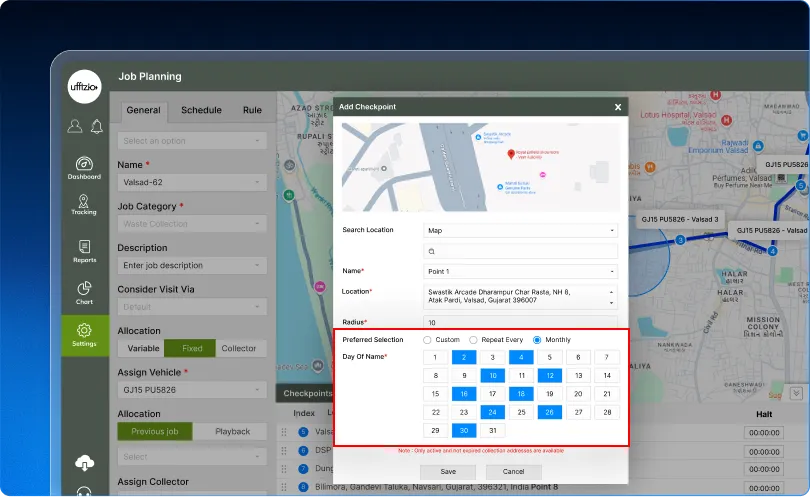
Job Planning now provides expanded scheduling options for Areas and Checkpoints.
Repeat Every for Areas
Teams can now assign a recurring schedule when adding Areas to a job. This allows different areas to be assigned to the same vehicle on different days or at defined intervals.
Monthly Scheduling for Checkpoints
Checkpoints can now be planned using a Monthly schedule, allowing teams to assign specific dates to operational groups.
For services such as Bin Washing, large numbers of bins can be divided into groups based on route, vehicle capacity, and operational requirements, with each group assigned its planned service dates.
 Why It Matters
This enhancement takes route planning from manual and ad-hoc scheduling to structured, advance planning.
Teams can now define the schedule once and ensure that the right area or checkpoint is available on the right day, helping operations stay aligned with the planned route and service schedule.
Plan smarter. Execute accurately. Keep every route on schedule.
Conclusion
With every release, we continue to evolve the platform around the changing needs of modern businesses. These enhancements are another step toward delivering greater efficiency, stronger control, deeper insights, and a better overall experience helping you get more from the platform every day.
Because meaningful innovation isn’t just about adding more features it’s about creating more value.