What’s New for the month of October 2025
")
At Uffizio, innovation never stops. Our teams are constantly refining, enhancing, and adding new capabilities to make your telematics experience smarter, faster, and more intuitive. Here, you’ll find the latest updates across our software platforms — from new features and performance improvements to customer-driven enhancements that make fleet and asset management even more efficient.
1. Trakzee Updates
1.1 Smarter route optimization with vehicle type and toll options
Route planning just got sharper. We’ve enhanced the route optimization module with advanced configuration options powered by the HERE map routing API. Now, you can customize routes based on how your vehicles actually operate and save on costs while doing it.
- Choose vehicle type: Select from car, truck, bus, scooter, taxi, and more to get routes that fit your fleet.
- Avoid toll roads: Skip toll booths and roads to reduce trip expenses.
- Use live traffic: Enable real-time traffic data to plan faster, more accurate routes.
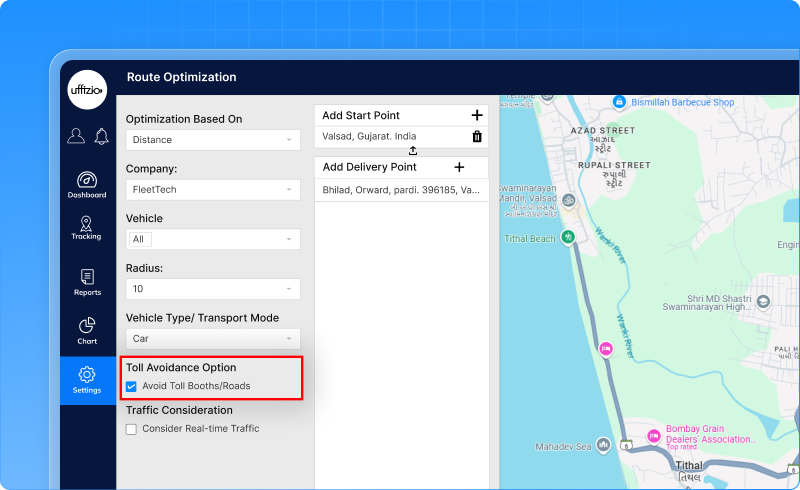
The update improves operational efficiency, reduces transportation costs, and enhances resource utilization. It uses smarter, vehicle-specific routing when HERE maps is selected as the mapping provider.
1.2 Flexible control for private mode
Managing private mode is now more flexible. Earlier, once activated, private mode couldn’t be deleted or ended before its valid date. With this enhancement, you can now set an end date to stop private mode whenever needed without losing its history.
- Add an end date to deactivate private mode early.
- Keep full visibility of past entries for records and audits.
- End date automatically stops private mode once reached.
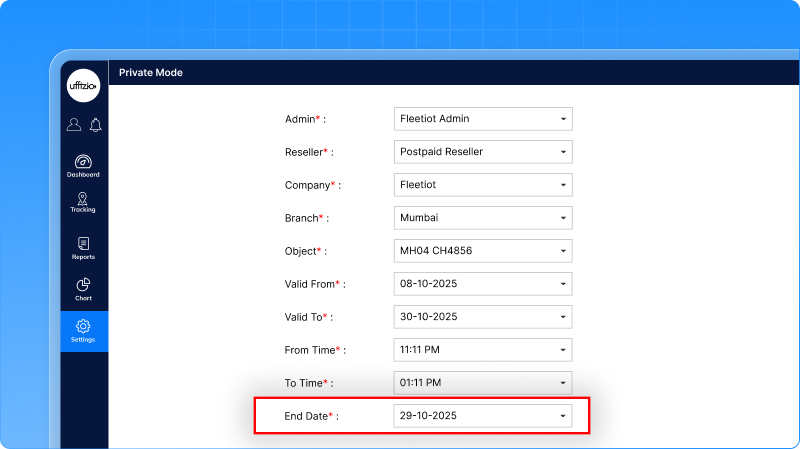
This gives users more control, improves transparency, and keeps data clean and compliant without affecting ongoing settings or reports.
1.3 Track every change with distance counter history
We’ve made the distance counter more transparent than ever. Now, every manual change made to a vehicle’s distance value will be automatically logged and displayed with full details — ensuring complete visibility and accountability.
- Every update to the distance counter now records the old value, new value, date, and user who made the change.
- A new history icon beside the distance counter field lets you view all past updates in one click.
- When an object is deleted, its related history is automatically removed to keep your database clean.
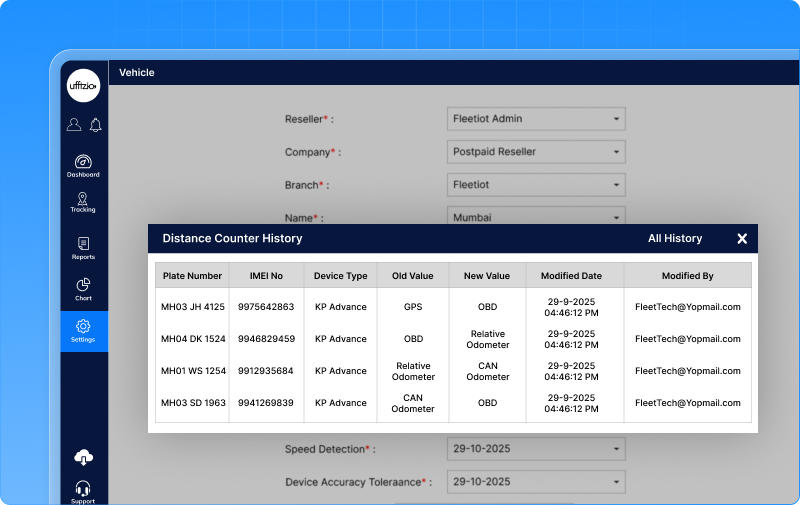
This enhancement helps you maintain audit-ready records, prevent unauthorized changes, and ensure data accuracy across your fleet operations.
1.4 Branch-level template creation for alerts
Alert templates are now more flexible and branch-specific. Earlier, templates could only be created at the company level, meaning all branches followed the same alert format. With this enhancement, you can now create and manage templates for individual branches too.
- A new branch dropdown lets you assign templates to a specific branch or apply them company-wide.
- Supervisors or in-charges can now receive alerts tailored to their branch’s needs.
- Existing company-level templates remain unchanged and continue to work as before.
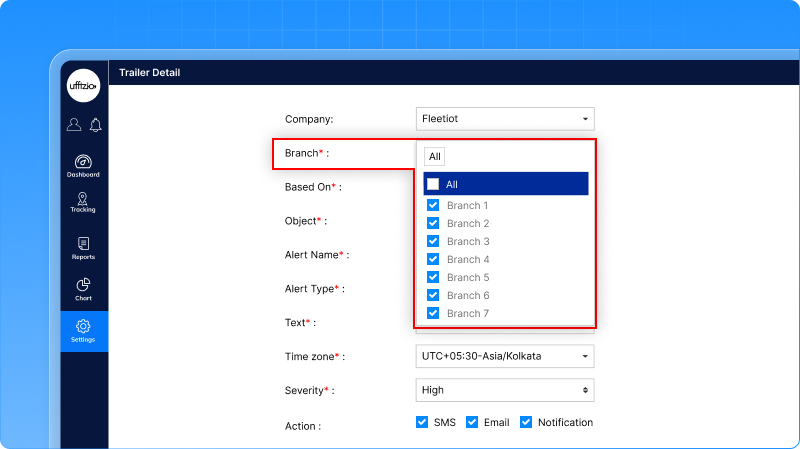
This update gives teams greater control, helping each branch operate independently while maintaining company-wide consistency in alert management.
1.5 Cleaner, smarter EV dashboard widgets
We’ve redesigned the EV dashboard widgets to make data easier to read and interpret at a glance. The earlier pie charts with too many ranges have now been replaced with clean, card-style widgets that focus on clarity and quick insights.
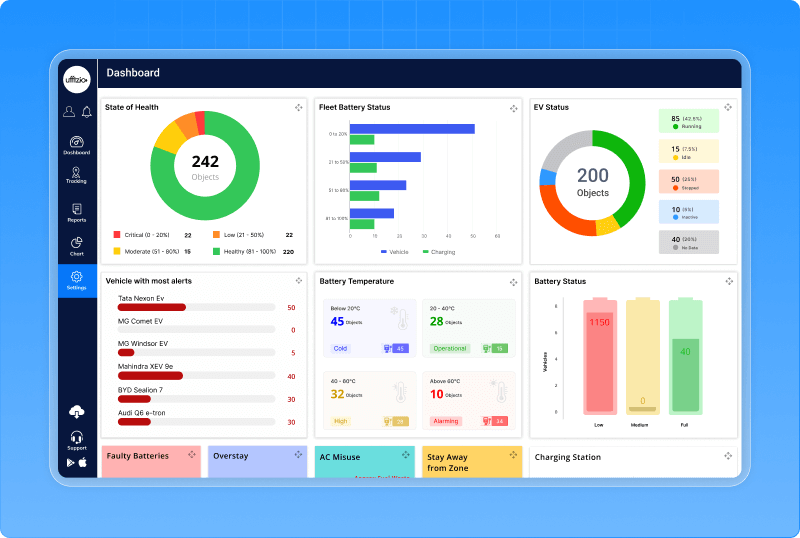
- Simplified ranges: Each widget now shows fewer, clearer value ranges, making trends easier to spot.
- Card-based layout: Important details like battery health, temperature, and charging status appear in well-organized cards instead of pie charts.
- Better readability: Real-time data like SOC, temperature, and battery health are displayed in easy-to-scan blocks, helping you act faster.
- Consistent design: The look and feel align with Trakzee’s modern dashboard theme.
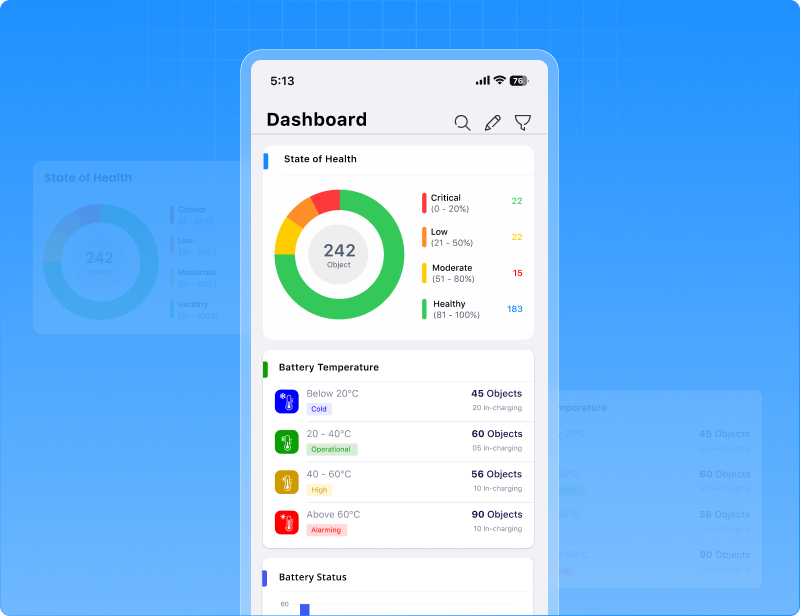
This update turns complex EV data into quick, actionable insights, helping fleet managers monitor performance effortlessly both on the web and mobile.
1.6 New EV performance charts for deeper insights
We’ve expanded EV analytics beyond playback. Fleet managers can now view and analyze EV performance charts directly under the charts section in Trakzee — offering easier access to detailed insights without running playback sessions.

- Dedicated BMS category: A new chart group for EV data under “BMS.”
- Comprehensive metrics: View SOC vs time, temperature vs time, consumption vs distance, and voltage vs current – all in one place
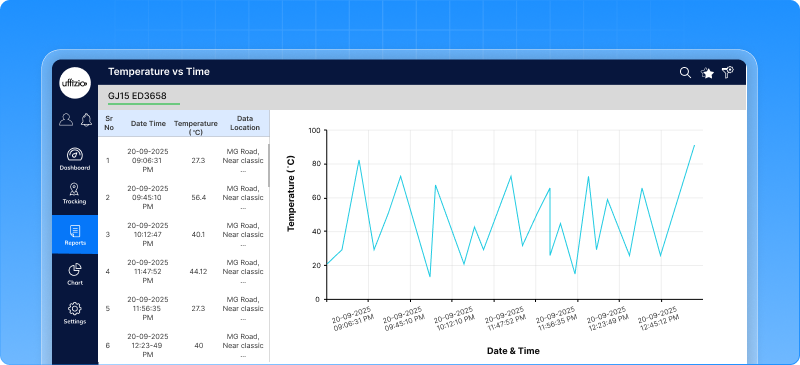
- Fleet & object-level analysis: Get clear trends for individual vehicles or your entire EV fleet.

- Easy export options: Download charts in PDF, XLS, or PNG formats for quick reporting and presentations.

This update gives you a clearer, more flexible way to monitor EV performance and make informed decisions faster — anytime, without relying on playback.
1.7 Visual RPM trends for better engine insights
Fleet managers can now see RPM data in an easy-to-read chart format instead of just tables. This new update introduces RPM vs time graphs in both web and mobile apps, helping you visualize engine performance at a glance.
- RPM chart view: Added to the RPM summary report click the chart icon to see RPM trends over time.
- New RPM category: Access all your RPM charts directly under the new “RPM” section in charts.
- Interactive features: Zoom, toggle legends for ignition, power, and speed, and view detailed tooltips for each timestamp.
- Quick downloads: Export the chart as a PDF or textual report for easy sharing and recordkeeping.
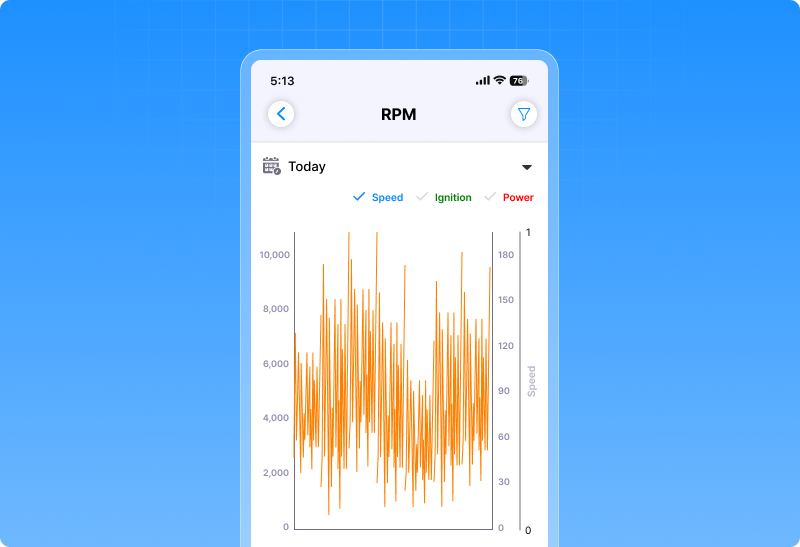
This enhancement turns raw RPM data into clear, visual insights making it easier to track performance, spot anomalies, and improve vehicle health monitoring.
1.8 Temperature insights added to geofence reports
We’ve made geofence monitoring more insightful with the addition of temperature data in the geofence visited detail report. Now, fleet managers can track not just when a vehicle entered or exited a location but also how the temperature changed during that stay.
- New temperature columns: View entry temperature, exit temperature, and average temperature during the geofence stay.
- Complete visibility: Data is available in both reports and exports (XLS, PDF, CSV).
- API ready: Temperature readings can now be fetched through APIs for deeper analytics or third-party integrations.
- Mobile support: The same insights are available on mobile with improved report columns for a consistent experience.
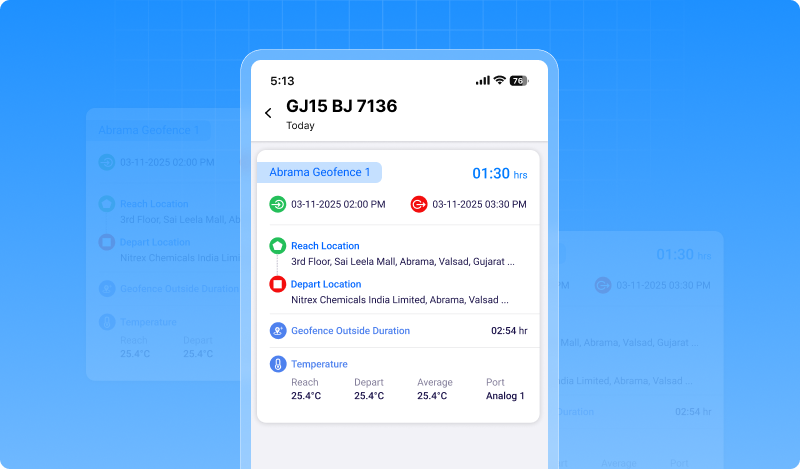
This enhancement gives users a more complete picture of environmental conditions during each geofence visit — ideal for temperature-sensitive operations like cold chain transport.
1.9 Tank-wise fuel consumption now visible
Fuel monitoring just got more precise. For vehicles equipped with multiple fuel tanks and sensors, fleet managers can now view individual consumption for each tank not just a combined total.
- Tank-wise visibility: When the fuel calculation mode is set to Individual, the fuel widget now displays separate readings for each sensor.
- Detailed insights: Both the sensor tab and the tooltip widget show tank-specific consumption in real time.
- Mobile support: The same tank-wise breakdown is now visible in the mobile app for quick checks on the go.
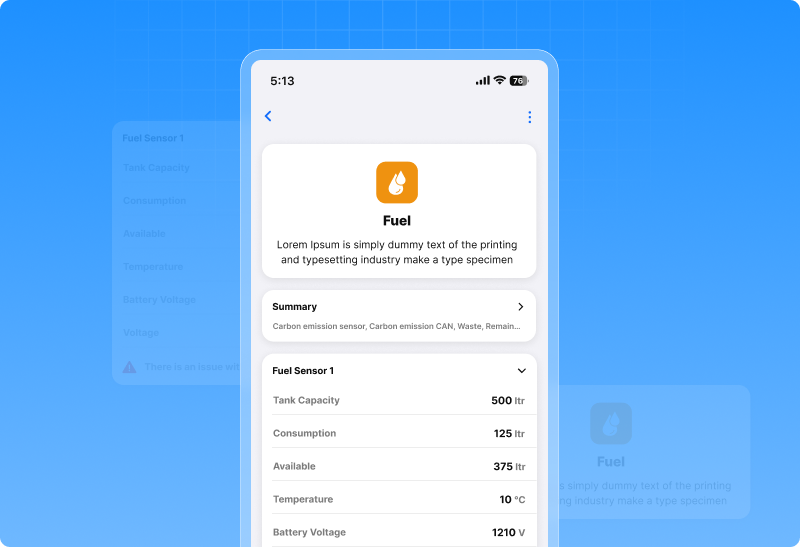
This enhancement gives operators complete transparency over multi-tank fuel usage helping detect leaks, reconcile discrepancies, and manage fuel more efficiently than ever.
1.10 Easier visibility of active and inactive customers
We’ve made it simpler for admins, resellers, and company users to track customer activity. The company overview screen now clearly shows whether each customer is active or inactive, helping teams manage accounts more efficiently.
- New status column: Quickly see user status (active/inactive) right from the overview screen.
- Export support: The same status column is now included in exported company data for better reporting.
- Role-wide access: Available for admin, reseller, and company-level users with sorting and filtering options.
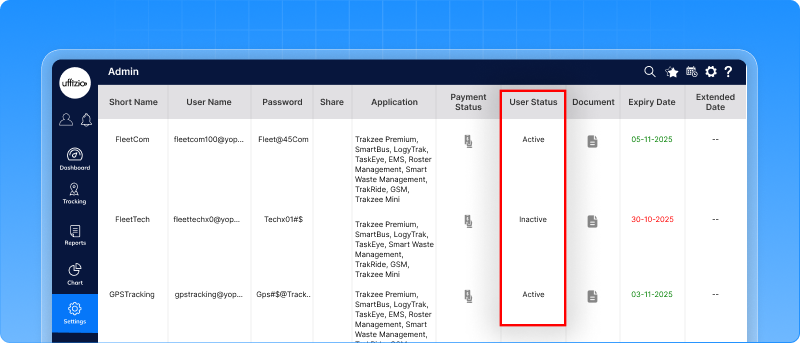
This update improves visibility and streamlines customer management, ensuring smoother business operations at every level.
1.11 New EV alerts for smarter battery monitoring
Fleet managers can now stay one step ahead with new EV battery alerts added to the BMS category. These alerts help users monitor the most critical EV battery parameters in real time, keeping vehicles safe, efficient, and well-maintained.
- SOC alerts: Get notified when the state of charge goes above or below your defined range.
- Battery temperature alerts: Receive instant alerts if the battery temperature crosses safe limits.
- SOH alerts: Track battery health to identify long-term degradation early.
- BMS charging alerts: Know when charging starts, stops, or exceeds the set duration.
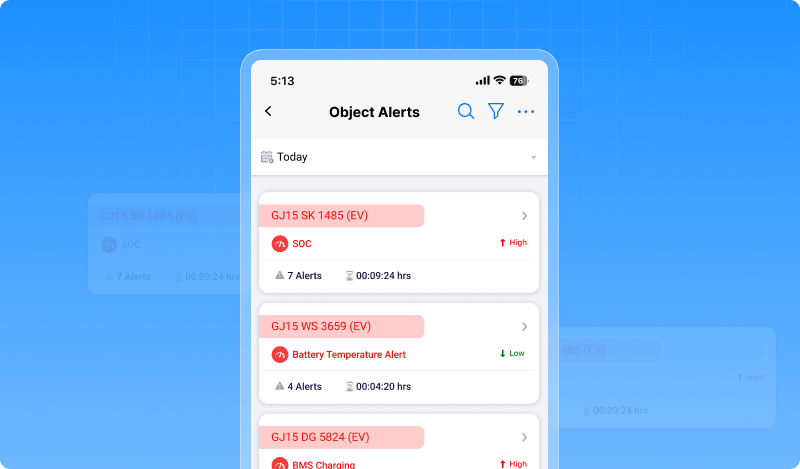
Available on both web and mobile, these alerts support all notification channels in-app, email, SMS, and push notifications ensuring you never miss a critical update about your EV fleet’s battery status.
1.12 New API to retrieve device log data (IMEI-wise)
We’ve introduced a new web service API that allows external systems to fetch device log data directly using IMEI numbers. This feature improves integration, transparency, and real-time data access for partners and third-party systems.
- IMEI-based access: Retrieve the latest or last available log data for any device.
- Comprehensive information: Access both processed details (speed, location, GPS status) and raw protocol messages.
- Integration ready: Ideal for third-party systems needing live or historical data sync.
- Error handling: Ensures smooth responses even for missing or unregistered devices.
This enhancement strengthens cross-platform communication and ensures consistent, reliable access to critical tracking data.
1.13 GPS alerts now smarter with duration filter
We’ve made GPS alerts more accurate by introducing a new duration parameter in the alert configuration. This enhancement ensures alerts are triggered only when the GPS condition (On/Off) persists for a set time, helping reduce false or momentary alerts.
- New duration field: Added to the GPS alert configuration screen on both web and mobile.
- Customizable timer: Define how long a GPS condition must remain active before triggering an alert (from 0 to 3600 seconds).
- Smarter alert logic:
- Duration = 0: Triggers immediately (no change to existing behavior).
- Duration > 0: Triggers only after the set time is met continuously.
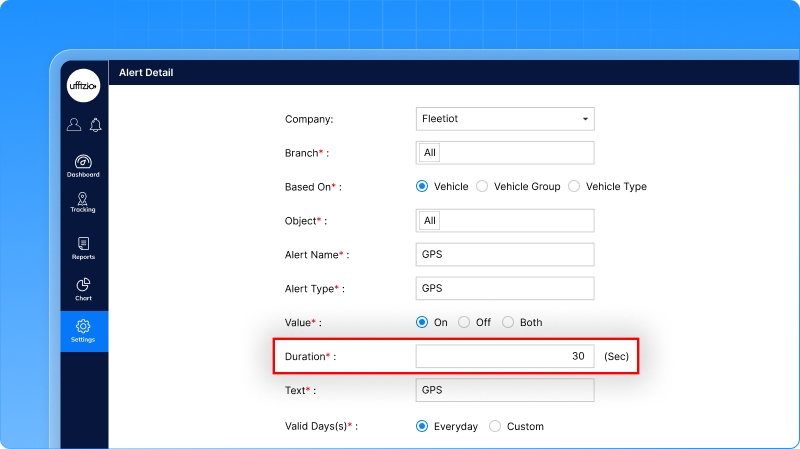
This update helps users receive more reliable alerts and ensures that only genuine GPS issues are reported minimizing unnecessary notifications and improving operational clarity.
1.14 Custom time view for live vehicle updates
We’ve added more flexibility to how you view vehicle data timestamps in the live tracking panel. You can now decide whether to see the actual time (from the device) or the received time (from the server) for every vehicle update.
- New time selection option: Under object list settings → choose columns → object activity, you can now select your preferred time display.
- Two clear choices:
- Received time – When the data reached the server. (default option)
- Actual time – When the data was captured by the device.
- Personalized view: Each user’s selection is saved, even after login or page refresh.
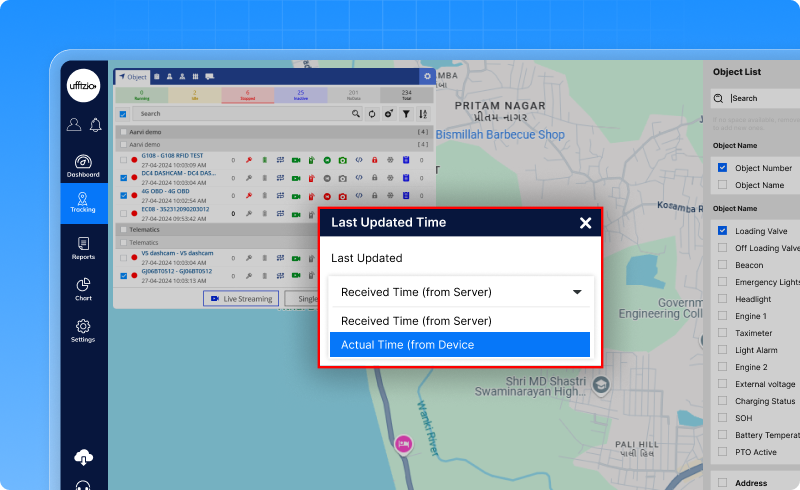
This enhancement eliminates timestamp confusion, giving you full control and clarity when tracking vehicles — especially in cases of delayed data transmission.
1.15 New load status report for smarter fleet utilization
Managing vehicle load just got easier. The new load status report gives fleet managers a complete view of how vehicles are being utilized, helping detect underloaded or overloaded conditions in real time.
- Real-time load tracking: See the exact load of each vehicle using calibrated load sensor data.
- Instant overload alerts: Identify underweight or overweight vehicles based on tolerance levels.
- Detailed insights: View company, branch, vehicle type, speed, and location alongside load data.
- Load utilization metrics: Automatically calculate load percentage and remaining capacity for each vehicle.
- Easy export & scheduling: Generate reports in XLS, PDF, or CSV and schedule them just like object status reports.
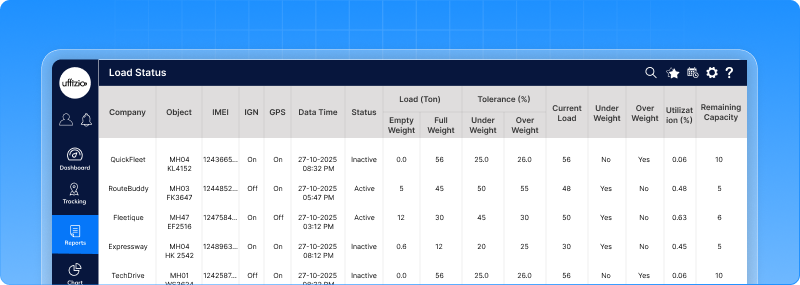
This new report helps optimize fleet operations, prevent fines from overloading, and ensure every vehicle runs at peak efficiency.
1.16 Fleet safety just got smarter, introducing object stolen & hijack alerts
Fleet safety takes center stage with two new security alerts object stolen and object hijack now available in the GPS application. These alerts are designed to notify users instantly when a vehicle theft or hijack event is reported by the GPS device, ensuring immediate response and complete traceability.
- New alert types: Object stolen and object hijack, both mapped through digital input sensors.
- Instant notifications: Alerts trigger automatically and are sent via web, mobile, SMS, email, and push within seconds.
- Multi-language support: Alert messages adapt to each user’s preferred language.
- Detailed alert logs: Every event is recorded in the alert history with vehicle plate number, time, and location for future reference.
- Flexible configuration: Users can customize notification channels and escalation methods, including IVR and command-based actions.
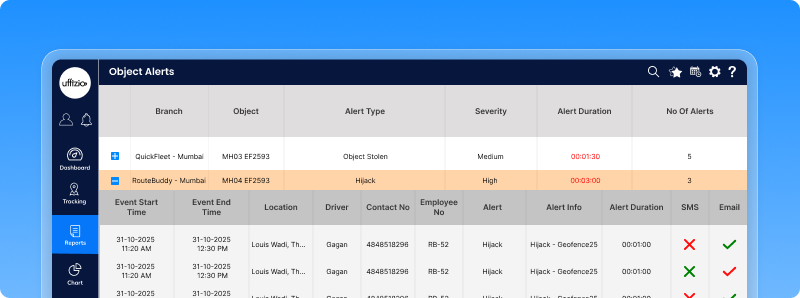
This update strengthens fleet security and helps users act faster in critical situations protecting assets, drivers, and operations with reliable, real-time intelligence.
1.17 Expanded PTO report with fuel & performance insights
The PTO (Power Take-Off) report just got smarter! This enhancement adds new fuel efficiency and performance metrics to give fleet managers a deeper understanding of how vehicles perform when PTO is engaged or disengaged.
- Engine time tracking: View total engine ON time (running + idling).
- Detailed PTO utilization: Separate ON and OFF durations for more accurate usage analysis.
- Fuel efficiency breakdown: Measure consumption with and without PTO engagement.
- Mileage insights: Calculate distinct mileage for PTO ON and PTO OFF operations.
- Refuel count & tank capacity: Monitor total refueling events and calibrated tank size.
- AC usage duration: Record how long the air conditioner was active to analyze auxiliary power load.
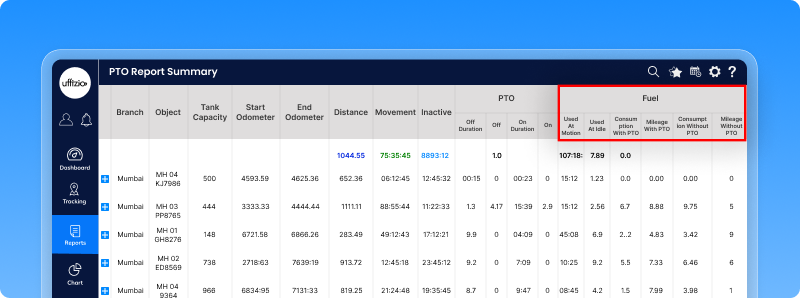
With these updates, fleet managers can now correlate fuel usage, equipment performance, and PTO operations more effectively — leading to smarter maintenance scheduling, reduced wastage, and better operational decisions.
1.18 Real-time mileage now visible in the fuel widget
Fleet managers can now instantly view real-time mileage (km/ltr) directly within the fuel widget — on both web and mobile applications.
- Live mileage display: Shows today’s mileage calculated using total distance travelled and fuel consumed.
- Dual view options:
- Based on distance: Distance ÷ fuel consumption (e.g., 12.5 km/ltr).
- Based on duration: Fuel consumed ÷ (Running + Idle Time) for efficiency tracking.
- Auto daily reset: Mileage data resets automatically at midnight.
- Data sources: Supports both fuel sensor and CAN-based consumption readings.
- Consistent across platforms: Available in both web and mobile fuel widgets for easy monitoring.
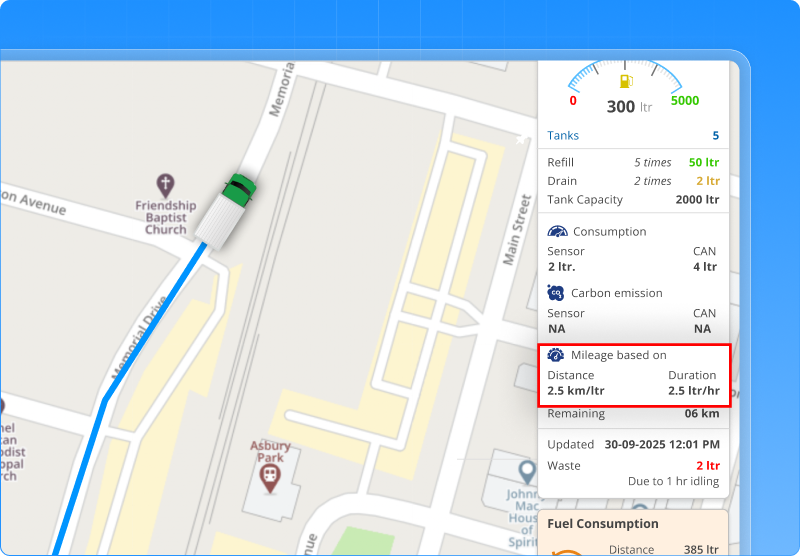
This enhancement helps users instantly assess vehicle fuel performance, analyze driving efficiency, and make informed decisions to optimize fuel usage and reduce costs.
1.19 GSM signal strength now visible in the vehicle list
Users can now view GSM signal strength directly from the Vehicle List without opening the right-hand widget improving visibility and quick decision-making during live tracking.
- GSM indicator added: Displays a 0–5 bar signal icon next to each vehicle for instant network status checks.
- Color-coded clarity:
- 🟢 Green → Strong/Excellent Signal
- 🟡 Yellow → Medium Signal
- 🔴 Red → Weak/No Signal
- ⚪ Grey → Not Available
- Hover insight: Hovering over the icon shows the exact GSM numeric value (e.g., “GSM: 75 – Good Signal”).
- Customizable setting: Users can choose to enable or disable the GSM icon in Vehicle List settings.
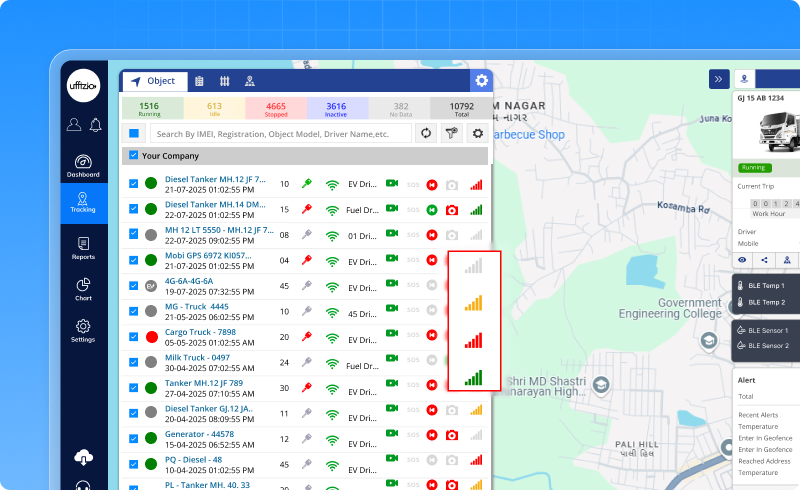
This update helps users quickly verify connectivity strength, improving response speed and operational reliability during critical actions like immobilisation or remote commands.
2. SmartWaste Updates
2.1 Smarter SOS notifications for faster emergency response
Handling multiple SOS alerts just got simpler. The latest update to the SmartWaste live tracking screen introduces a cleaner and more focused SOS notification panel that helps operators act faster during emergencies.
- Collapsed view: Only the latest SOS alert is displayed by default keeping the interface neat and focused.
- “View more [Count]” button: Instantly see how many more SOS alerts are pending, and expand to view them when needed.
- Quick toggle: Switch between “view more” and “collapse” without losing track of new alerts.
- Auto update: New SOS alerts automatically appear at the top, ensuring the latest emergency is always visible.
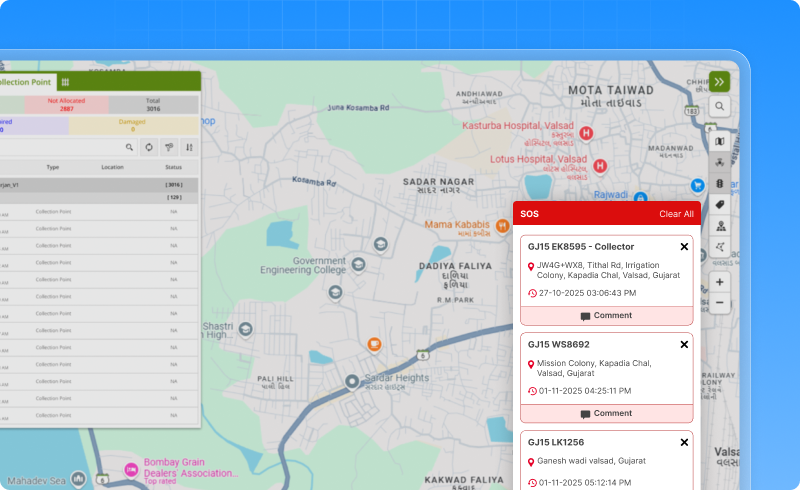
This enhancement ensures better visibility, quicker response times, and a clutter-free experience so supervisors can focus on the most critical alerts first while still retaining full access to the alert history.
2.2 Vehicle condition reports (VCR) now integrated in job detail summary
Fleet and waste collection managers can now get a complete operational picture with the new VCR integration in the job detail summary report. This enhancement ensures every job record also reflects the vehicle’s health before and after collection, creating a stronger link between field performance and asset condition.
- Pre-job & post-job VCR status: View whether the collector has completed the vehicle inspection before and after a job.
- Critical flag indicator: Instantly see if any VCR item was marked as “Critical.”
- Quick access pop-up: Click on any completed VCR status to open a detailed pop-up showing inspection questions, answers, and attachments.
- Export-ready data: All VCR-related columns are now available in report exports (PDF, XLS, CSV).
This update brings transparency, accountability, and compliance into job reporting, allowing supervisors to track both job performance and vehicle condition in one place.
2.3 Zone–ward wise collection coverage report
Supervisors and administrators can now measure daily waste collection coverage more precisely with the new zone–ward wise visits report. This enhancement brings analytical depth to field operations by correlating every collection address with real-time GPS data, ensuring full transparency in service delivery.
- Comprehensive coverage analytics: View total scheduled vs. visited addresses across each Town, Zone, and Ward.
- Accurate visit tracking: The system automatically validates visits using GPS coordinates ensuring each collection address is counted only once per day.
- Detail drill-down: Click any zone or ward to see the list of collection addresses, visit timestamps, and vehicle details.
- Export options: Reports can be exported in excel and PDF formats with both summary and detailed layers.

This report empowers municipalities to monitor daily performance, identify missed or low-coverage areas, and ensure accountable and optimized waste collection operations.
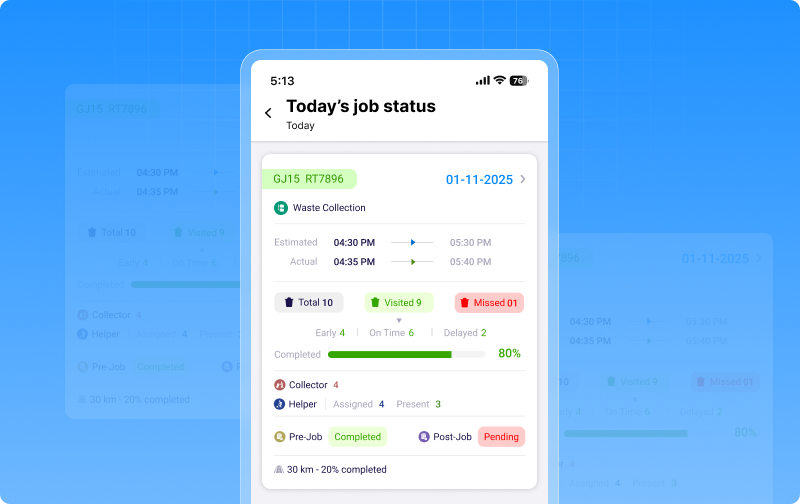
2.4 Smarter job tracking with real-time completion percentage and customizable icons
Supervisors can now see job progress at a glance with the new job completion percentage icon in the live tracking panel. The enhancement brings a more interactive and flexible interface, helping users focus on what matters most during daily operations.
- Live job progress: A dynamic circular icon now shows job completion percentage based on checkpoints or route distance updating automatically as work progresses.
- Customizable icon panel: A new ⚙️ settings button allows users to choose which icons appear in the job list (collector, helper, incident, alerts, or job completion %).
- Personalized view: Each user’s layout preferences are saved, ensuring a consistent experience every time they log in.
- Faster overview: Hover over icons for quick labels and insights without opening detailed screens.
![]()
This upgrade gives supervisors a cleaner, more configurable dashboard, making job monitoring faster, clearer, and more efficient.
2.5 Smarter tooltip view for object, device & document Info
To maintain consistency across platforms, the SmartWaste live tracking tooltip now mirrors the widget layout from Trakzee. This update introduces three structured widgets — object information, GPS device information, and document directly within the tooltip, giving users faster and clearer access to essential vehicle details.
- Consistent interface: The tooltip layout in SmartWaste now follows Trakzee’s familiar design, ensuring seamless usability for cross-platform users.
- Quick access widgets: View critical data at a glance with dedicated sections for object info, GPS device Info, and important documents.
- Improved usability: Cleaner structure and better data organization make it easier for operators to find information without switching screens.
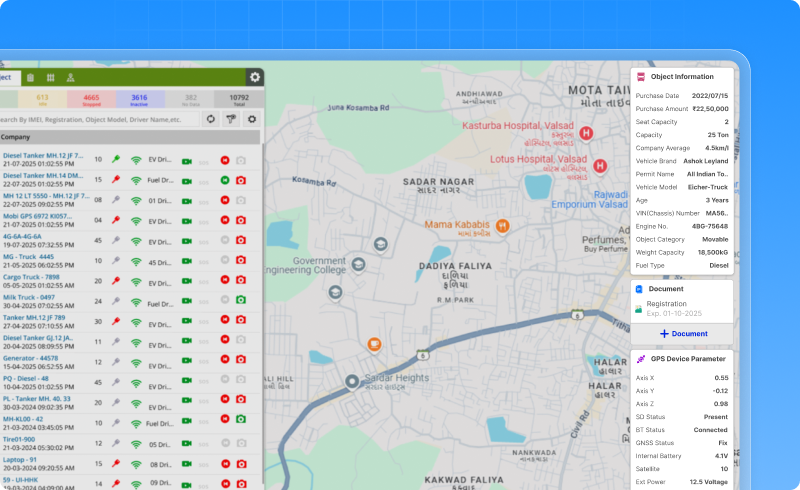
This enhancement delivers a uniform, intuitive, and data-rich interface, streamlining daily operations and improving overall user experience.
2.6 Share bin location instantly from live tracking
Managing waste operations just got more convenient! With this enhancement, users can now share a bin’s live location directly from the live tracking screen without relying on reports.
- New “share location” option in the bin tooltip and collection point list.
- Send location via email or mobile number to multiple recipients at once.
- Secure, time-bound link generation — recipients can view the bin’s location instantly on the map.
- Optional “reason” field lets users add context while sharing.
![]()
This feature brings faster coordination, better communication, and smoother field operations, keeping everyone aligned in real time.
2.7 Smarter halt time tracking using image timestamps
To make waste collection reporting more accurate, the checkpoint summary report now calculates actual halt time using image timestamps captured during QR code scans.
- Arrival and departure times auto-filled using before and after image submission timestamps.
- Actual halt time = (after image – before image) — ensuring precise duration tracking.
- Works across all job types, maintaining consistency with existing report logic.
- No performance impact — calculations are based on server time for accuracy.
![]()
This enhancement provides true field-based visibility, helping supervisors monitor real operational halts and improve accountability.
2.8 New compare path feature for smarter route analysis
The SmartWaste live tracking module now includes the compare path feature just like in Trakzee Premium!Users can now visually compare routes of multiple vehicles directly within the live tracking screen for deeper operational insights.
- Compare multiple vehicle paths side by side.
- View overlapping routes for better performance evaluation.
- Analyze route efficiency and identify deviations instantly.
- Accessible under live tracking → vehicle → compare path.
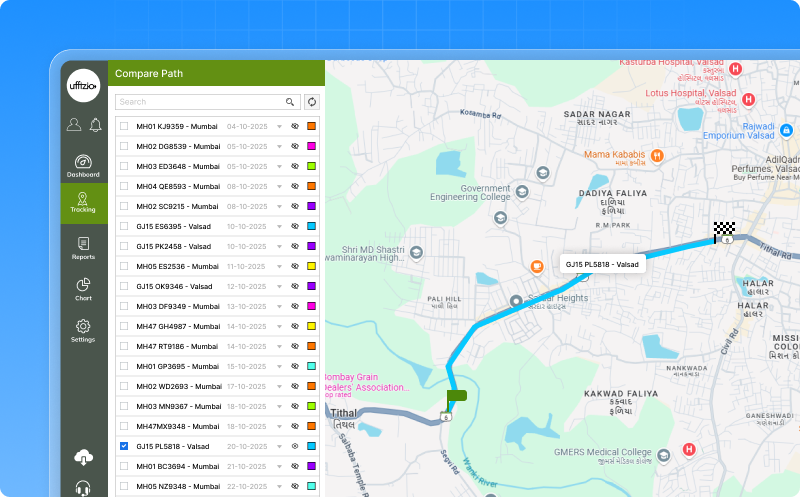
This feature helps supervisors evaluate route planning, optimize resource use, and improve decision-making with clear visual comparisons.
2.9 Generate checkpoint reports directly from the collection address tab
Supervisors and admins can now generate detailed checkpoint visit reports directly from the collection address tab, eliminating the need to navigate multiple modules.
- New “collection history” button beside Move To Job List.
- Select a date range to generate checkpoint details report instantly.
- View both summary (Town–Zone–Ward) and detailed visit logs with:
- Vehicle, job, and collector details
- Visit and halt timestamps
- QR/RFID tracking and weight information
- Export in XLS or PDF with summary and detail layers.
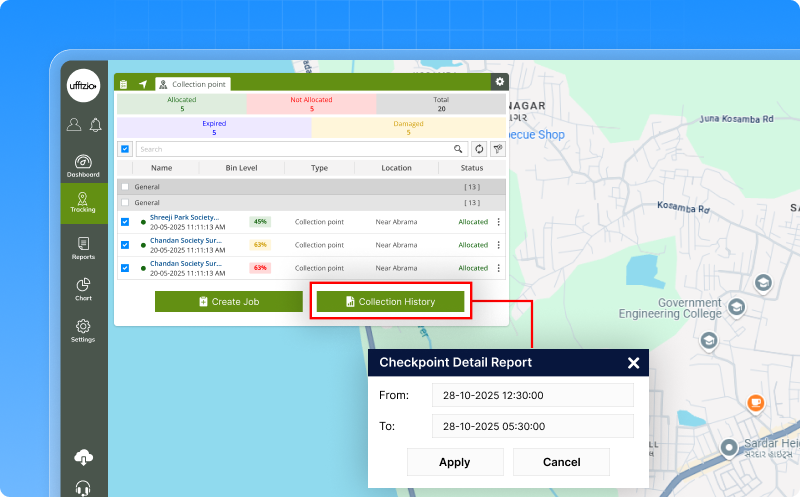
This enhancement makes it easier for supervisors to analyze service history, monitor performance, and validate on-field operations faster and more efficiently.