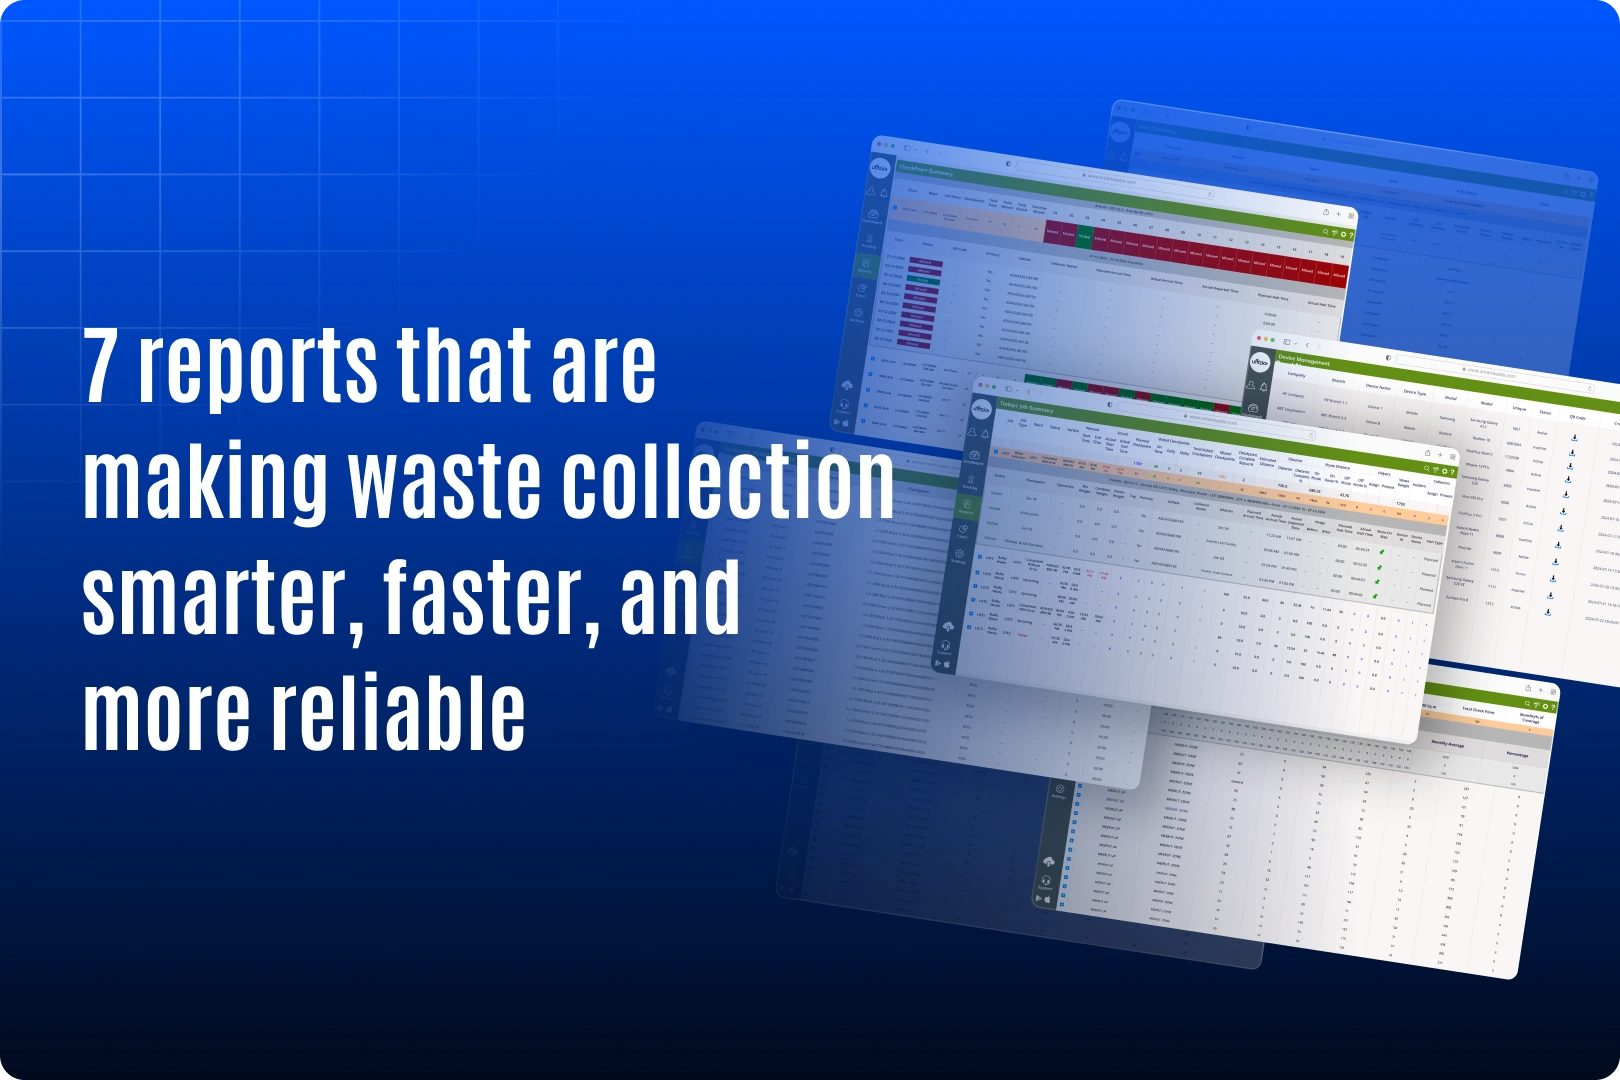
7 Reports That Are Making Waste Collection Smarter, Faster, and More Reliable

In today’s waste collection industry, assigning routes and hoping for the best is no longer enough. Growing cities, rising expectations, and tighter service agreements demand more than manual logs and end-of-day summaries. Fleet managers need real-time answers to questions like: What vehicle was where? Was the job completed? Were any complaints resolved?
Relying on phone calls, paper logs, or worse citizen complaints to detect issues means reacting late. By then, bins are missed, routes are delayed, and service quality suffers.
Digital reporting changes that. It gives supervisors and teams instant visibility into operations what’s happening, where, and when. Skipped checkpoints, unplanned stops, or delayed starts are flagged immediately, enabling corrective action before problems escalate.
The result? Faster resolutions, improved transparency, optimized routes, and higher client satisfaction. Digital reports don’t just support your operations- they drive them forward.
The 7 digital reports that are changing waste collection
1. Job summary report
Shows planned vs. completed jobs, checkpoint status (visited, missed, or planned), and total waste collected. It includes operational details like waste type and bin weight, tracks arrival/departure delays, and checks route compliance. Ideal for monitoring daily performance and spotting issues early.
2. Unplanned checkpoint report
Logs all off-schedule checkpoint visits along with vehicle, collector, and location details.
Includes arrival/departure timestamps, proof of visit, and comparison with the planned route.
Useful for identifying deviations and enforcing schedule compliance.
3. Checkpoint visited summary
Lists all visited checkpoints with timestamps and maps them for easy validation. Tracks halt durations at each location to assess idle time and operational efficiency. Also helps compare performance across time using monthly trend analysis.
4. Complaint summary report
Captures complaint subject, location, status, and contact info for better tracking and faster action. Each complaint is mapped and status-tagged (open, resolved, etc.) to ensure clear accountability. Managers can assign tasks or respond directly from the report.
5. Collection address summary
Tracks address-wise visit status to show which points were covered or missed. Supports category-based filtering (e.g., commercial, residential) and compares day-by-day/monthly coverage. Helps managers improve area-level planning and optimize operational focus.
6. Checkpoint summary report
Provides a count of visited and missed checkpoints, tracks day-by-day checkpoint activity, and flags repeated non-compliance. It also links checkpoint visits to specific vehicles for better accountability and operational review.
7. Area trip summary
Tracks visited and missed points in each area, time spent on trips, and total distance or weight handled. Helps with accurate time logs using UHF data, making it easier to balance coverage and optimize resource planning.
Business impact of using digital reports
- Save money: Spot areas with too many or too few trips and fix the routes.
- Act quickly: Get instant updates on missed pickups, delays, or complaints.
- Manage vendors better: Use clear reports to track how contractors are working.
- Keep citizens happy: Faster complaint handling builds public trust.
- Plan smarter: Use past data to plan budgets, expand services, or improve policies.
Final thought
Digital reporting is not just a dashboard, it’s a command center. Whether it’s resolving a complaint faster, catching a missed bin before a citizen calls, or planning better next week, analytics make waste collection smarter and more accountable. With real-time insights and clear accountability, teams can reduce delays, cut costs, and deliver reliable service.


